Even though the majority of new SSD launches are based on the M.2 form factor and the PCIe interface, new SATA SSDs keep appearing. Although they are very limited in terms of maximum transfer rates due to the interface, they still offer significant advantages over HDDs. TeamGroup already introduced the T-Force Delta MAX RGB SSD in 2019, followed by a cheaper version, the T-Force Delta MAX LITE SSD, at the beginning of the year. The Delta MAX LITE RGB SSD is available with 512 GB or 1 TB and stands out from the competition especially in terms of looks. The SSD offers a large RGB illumination including the T-Force logo, has a reflective surface and is available in black and white. Thus, the target group is probably mainly users who attach great importance to the looks and/or RGB lighting.
We will clarify which options the RGB lighting offers and whether the Delta MAX LITE RGB SSD can also convince in terms of performance in our review of the black 1 TB model.
Technical data
| Capacity | 1 TB |
| Interface | SATA 6.0 GB/s |
| form factor | 2.5″ |
| Flash type | 3D NAND TLC |
| Cache | no DRAM, SLC cache |
| Controller | unknown |
| Max. Read/write speed (MB/s) | 550/500 |
| Max. IOPS |
70,000/60,000 |
| Operating temperature | 0 °C – 70 °C |
| Scope of delivery | SSD, 5V ARGB 3-pin to USB micro-B cable, USB 10-pin to USB micro-B cable, sticker, cleaning cloth |
| Dimensions | 100 x 69.9 x 9.5 mm |
| Weight | 78 g |
| MTBF | 1 million hours |
| TBW | 800 TB |
| Guarantee | 3 years |
| Price | € 84.90 * |
As mentioned at the beginning, the TeamGroup T-Force Delta MAX LITE RGB is a slightly slimmed down and cheaper version of the Delta MAX RGB, which has been available for a while. TeamGroup does without a DRAM cache in the Delta MAX LITE RGB, and the sequential read and write rates are slightly lower at 550 and 500 MB/s, respectively. The speed can still be considered very good, since the SATA interface allows a maximum transfer rate of ~560 MB/s in practice and the differences between the available SSDs are therefore also only very small.
The manufacturer is reticent with details about the installed components. The controller is not known, and the memory is an unspecified 3D TLC NAND. The warranty period is up to 3 years and applies up to a write performance of 800 TB. The write performance can be considered very good and is above that of most other 1 TB SSDs.


Scope of delivery
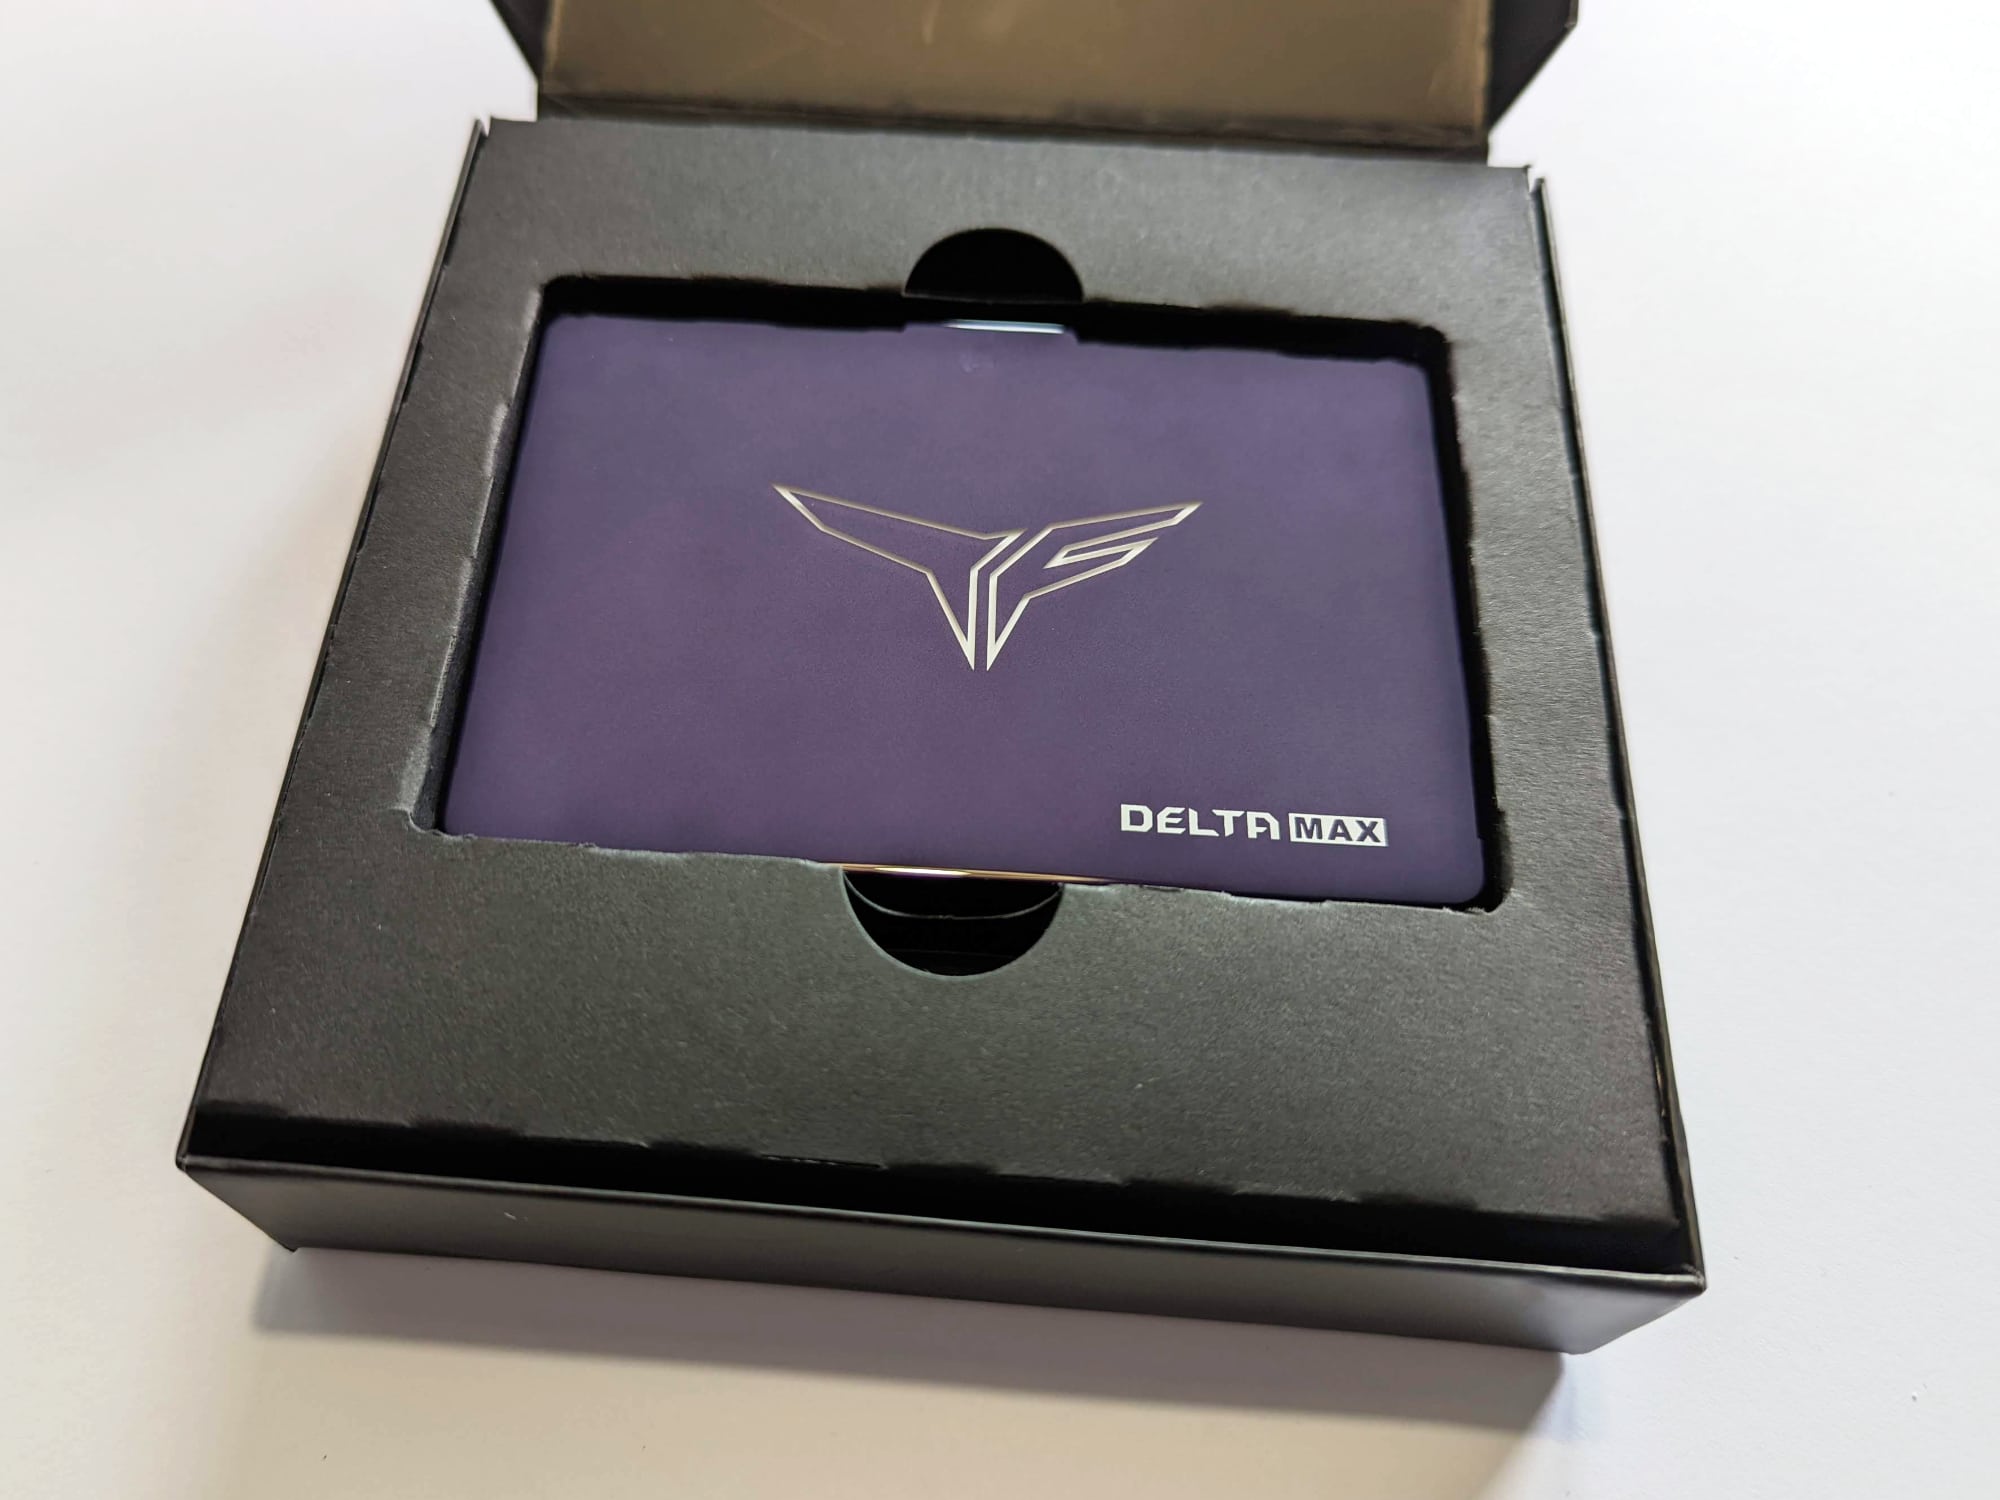
TeamGroup ships the T-Force Delta MAX LITE RGB in a sturdy black cardboard box, which is a bit larger than usual for SSDs. On the front, the SSD is pictured once with RGB lighting and once without, and there is also a reference to the capacity and the connection options for the RGB lighting. On the back of the box, we find more technical details and detailed information on how to control the RGB effects.

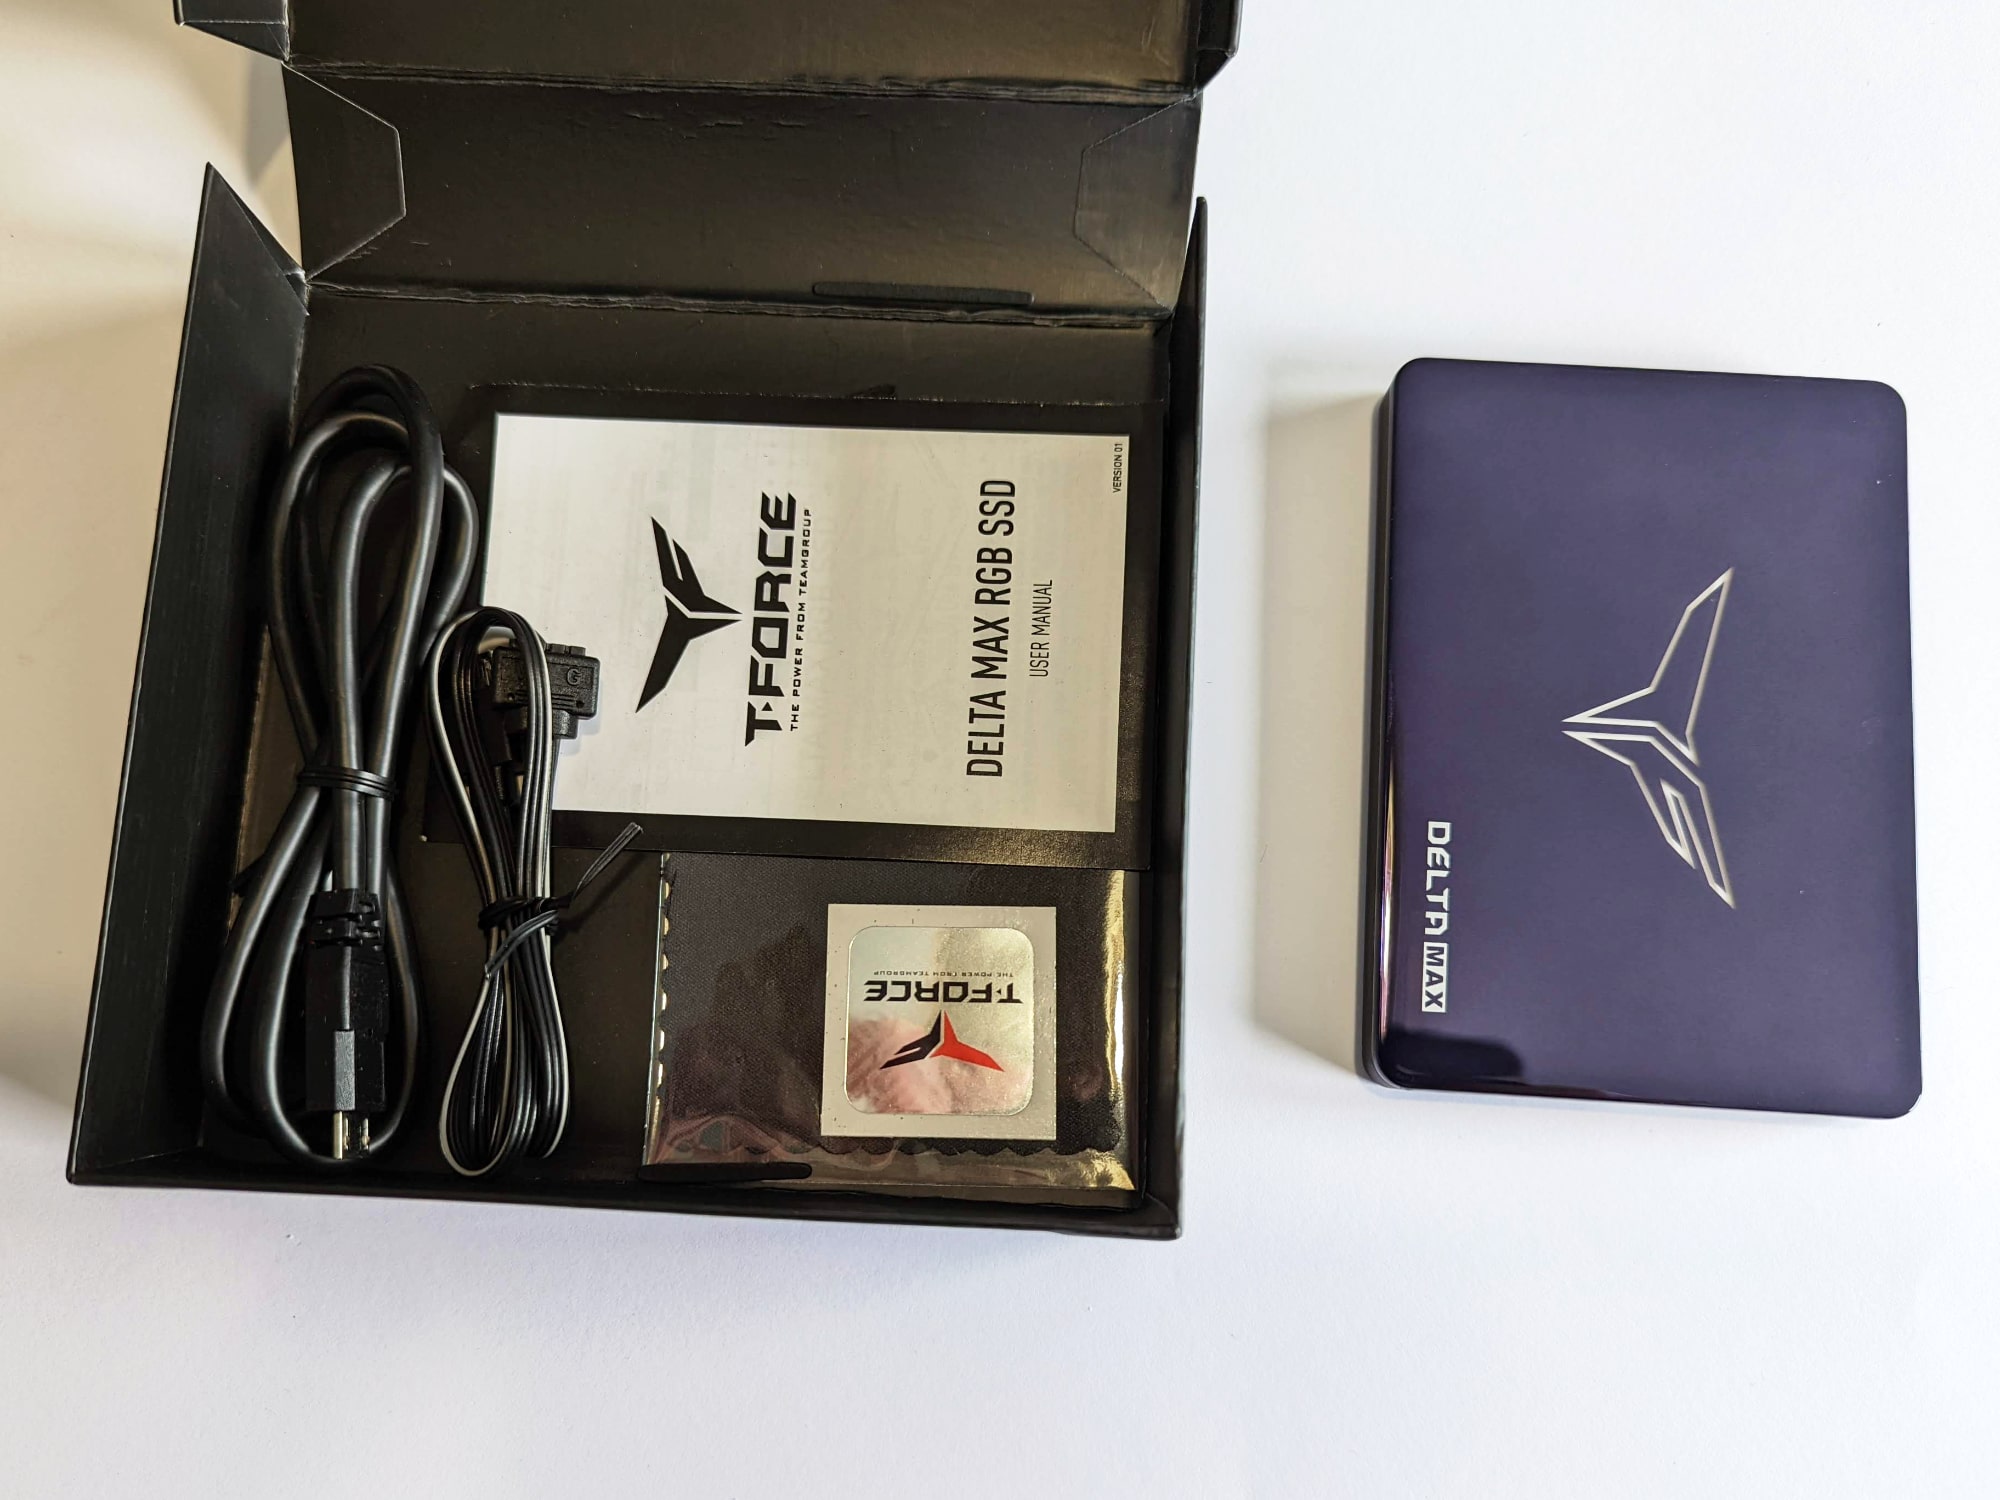
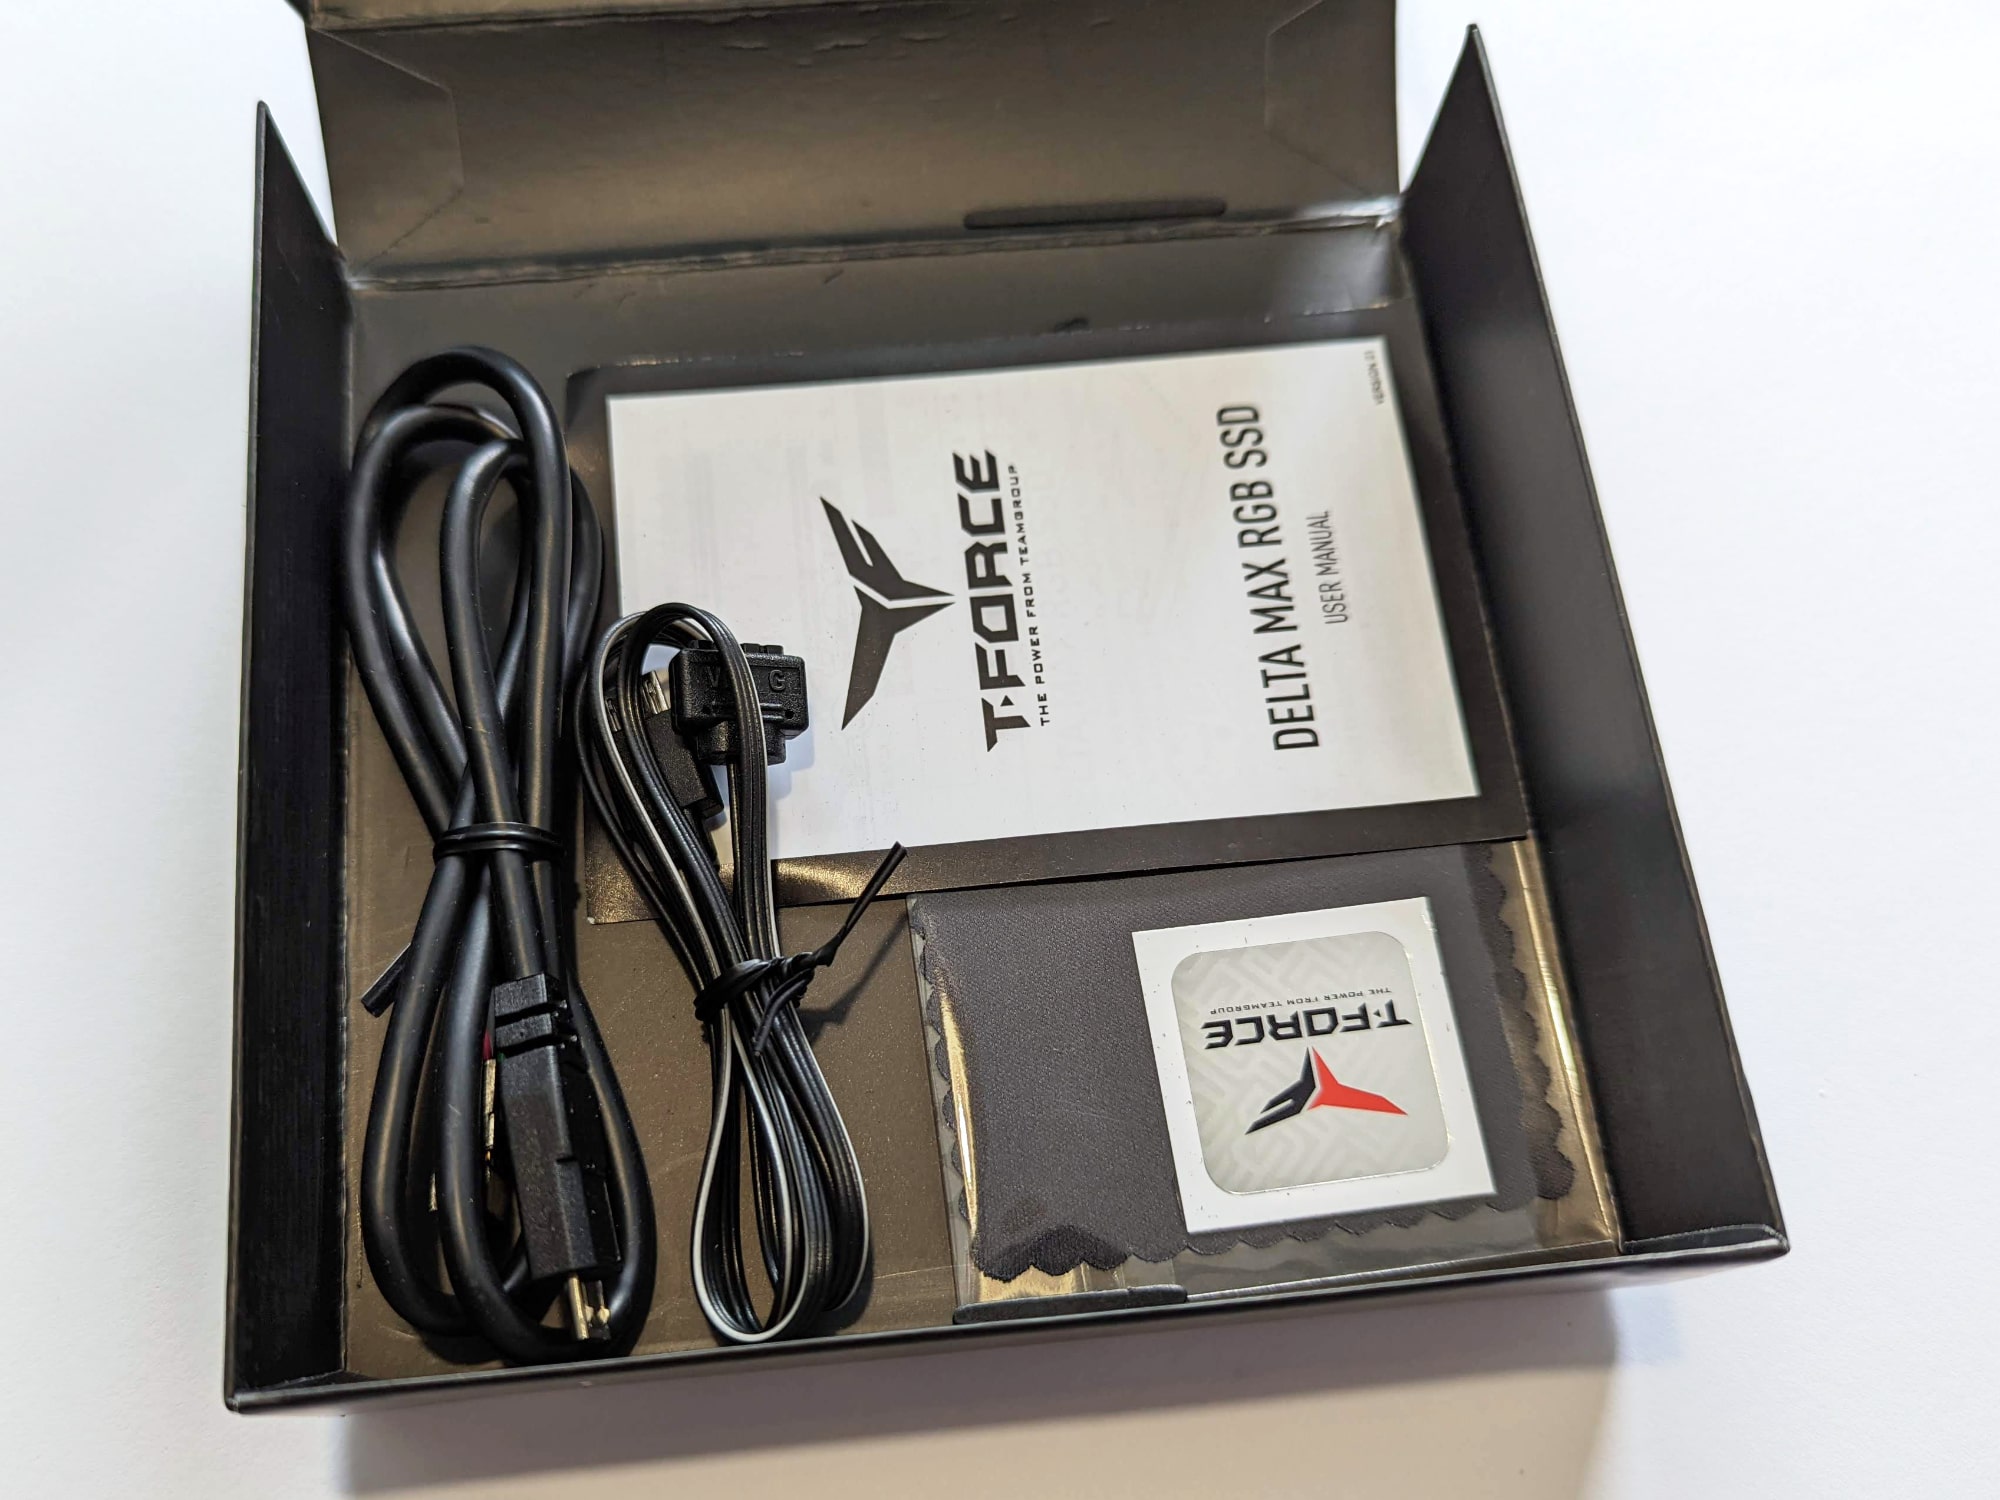
After opening the box, we look directly at the SSD, below which are the two connection cables, a short manual, a T-Force sticker, and a small cleaning cloth.
Design and RGB lighting
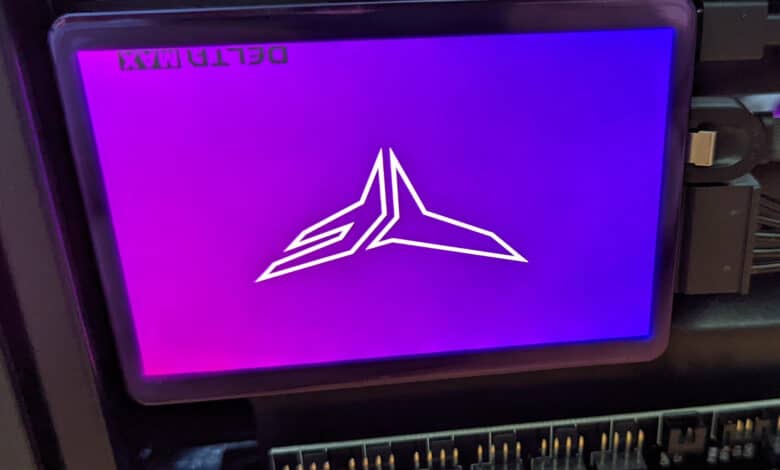
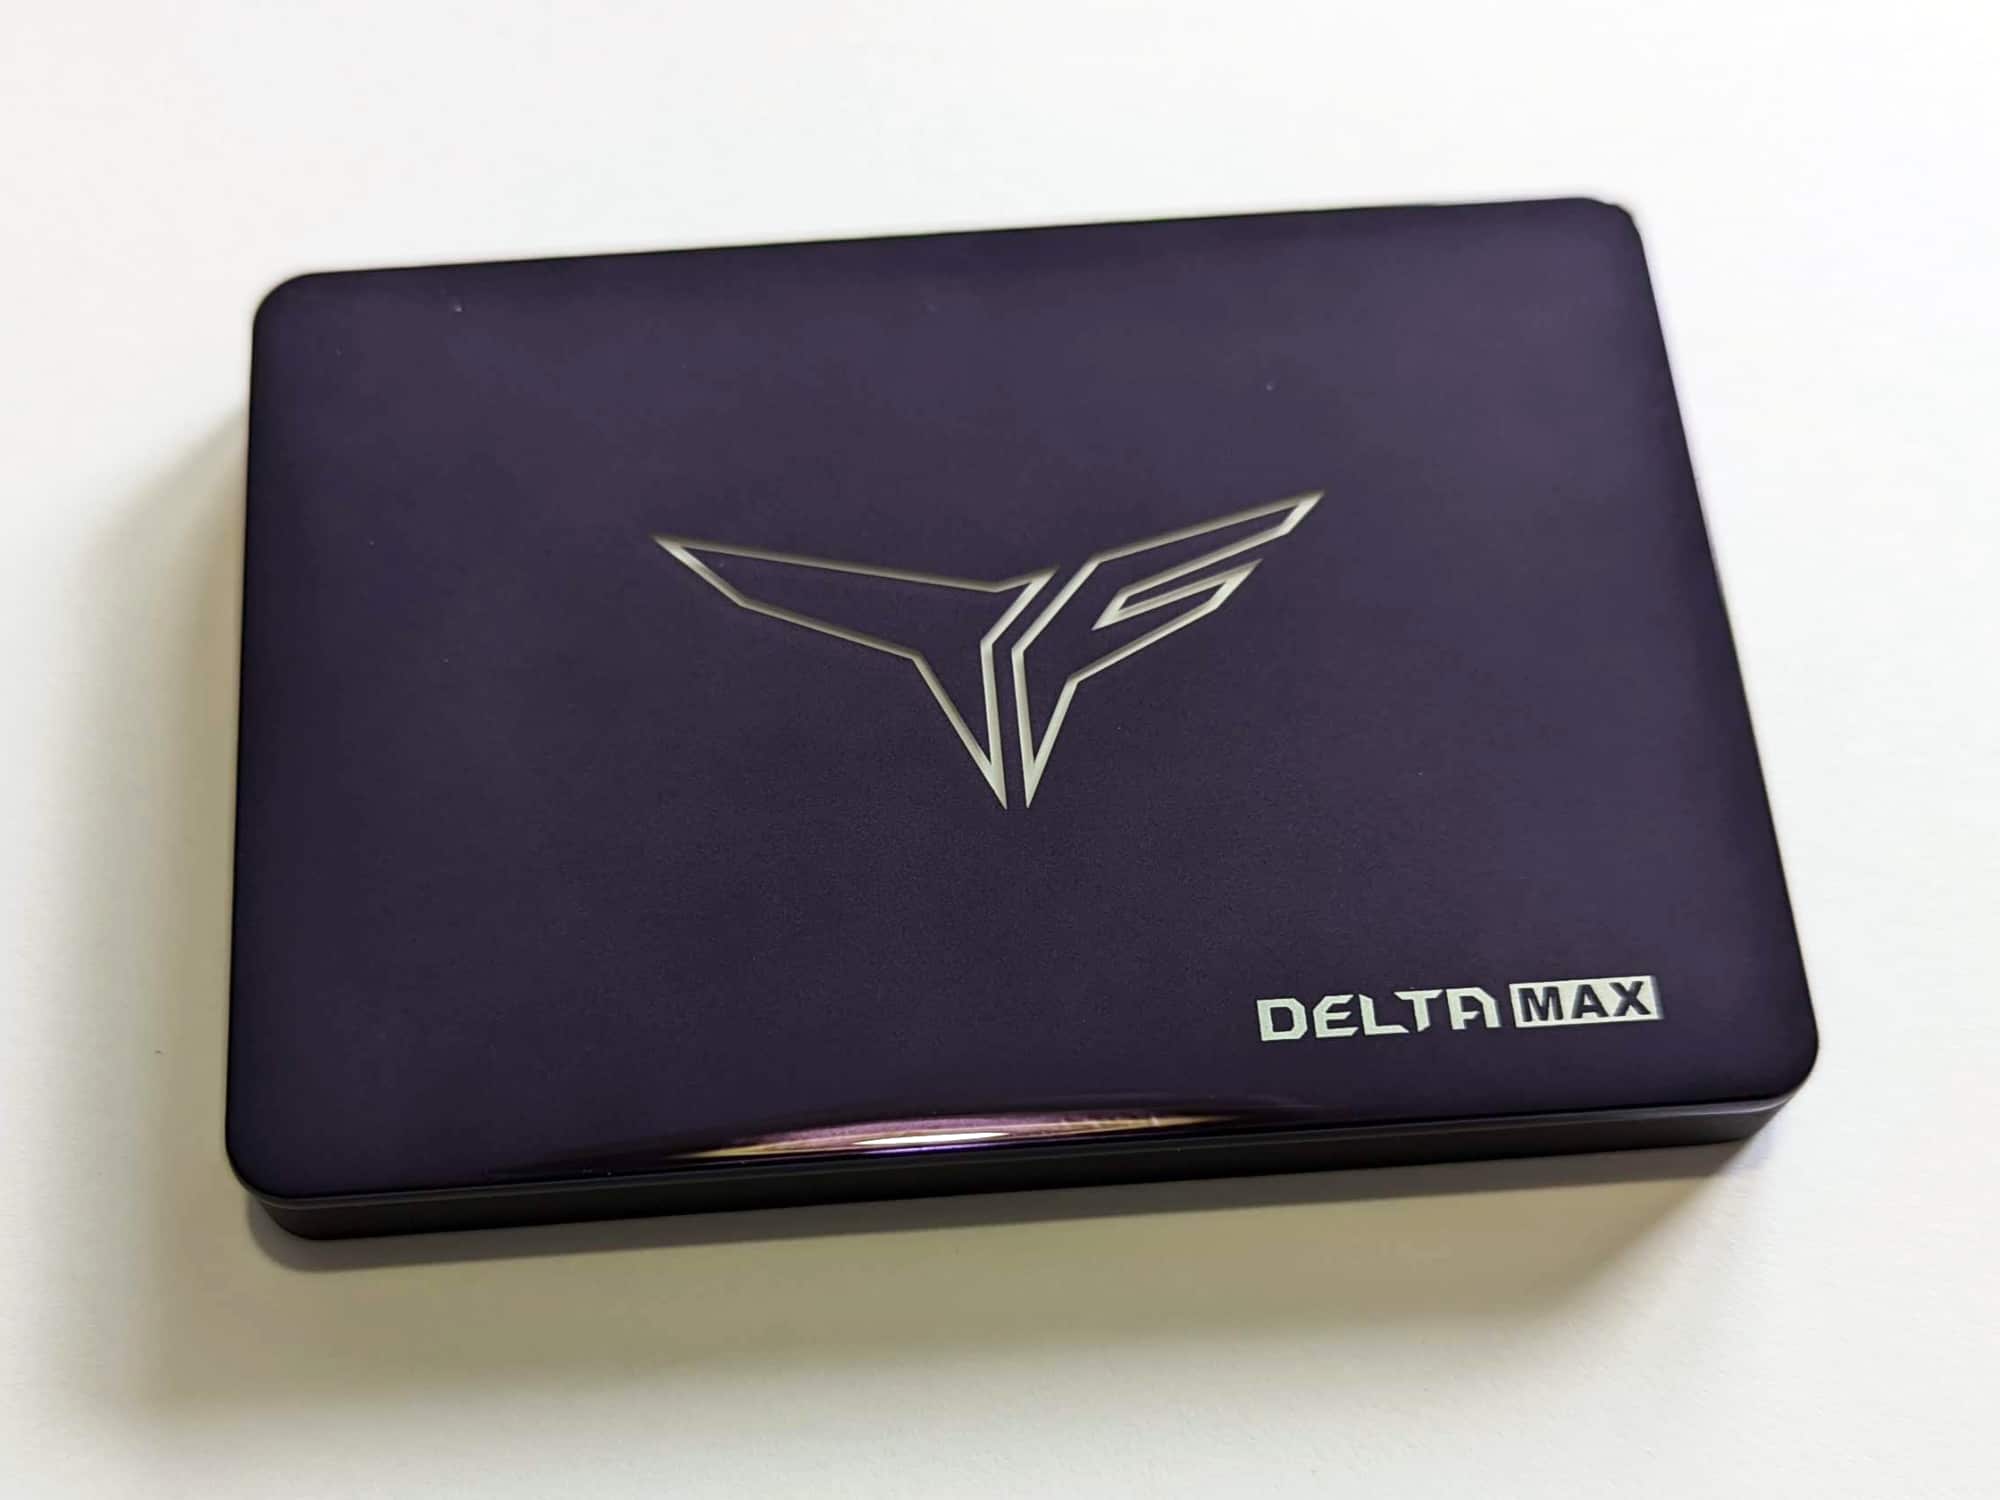
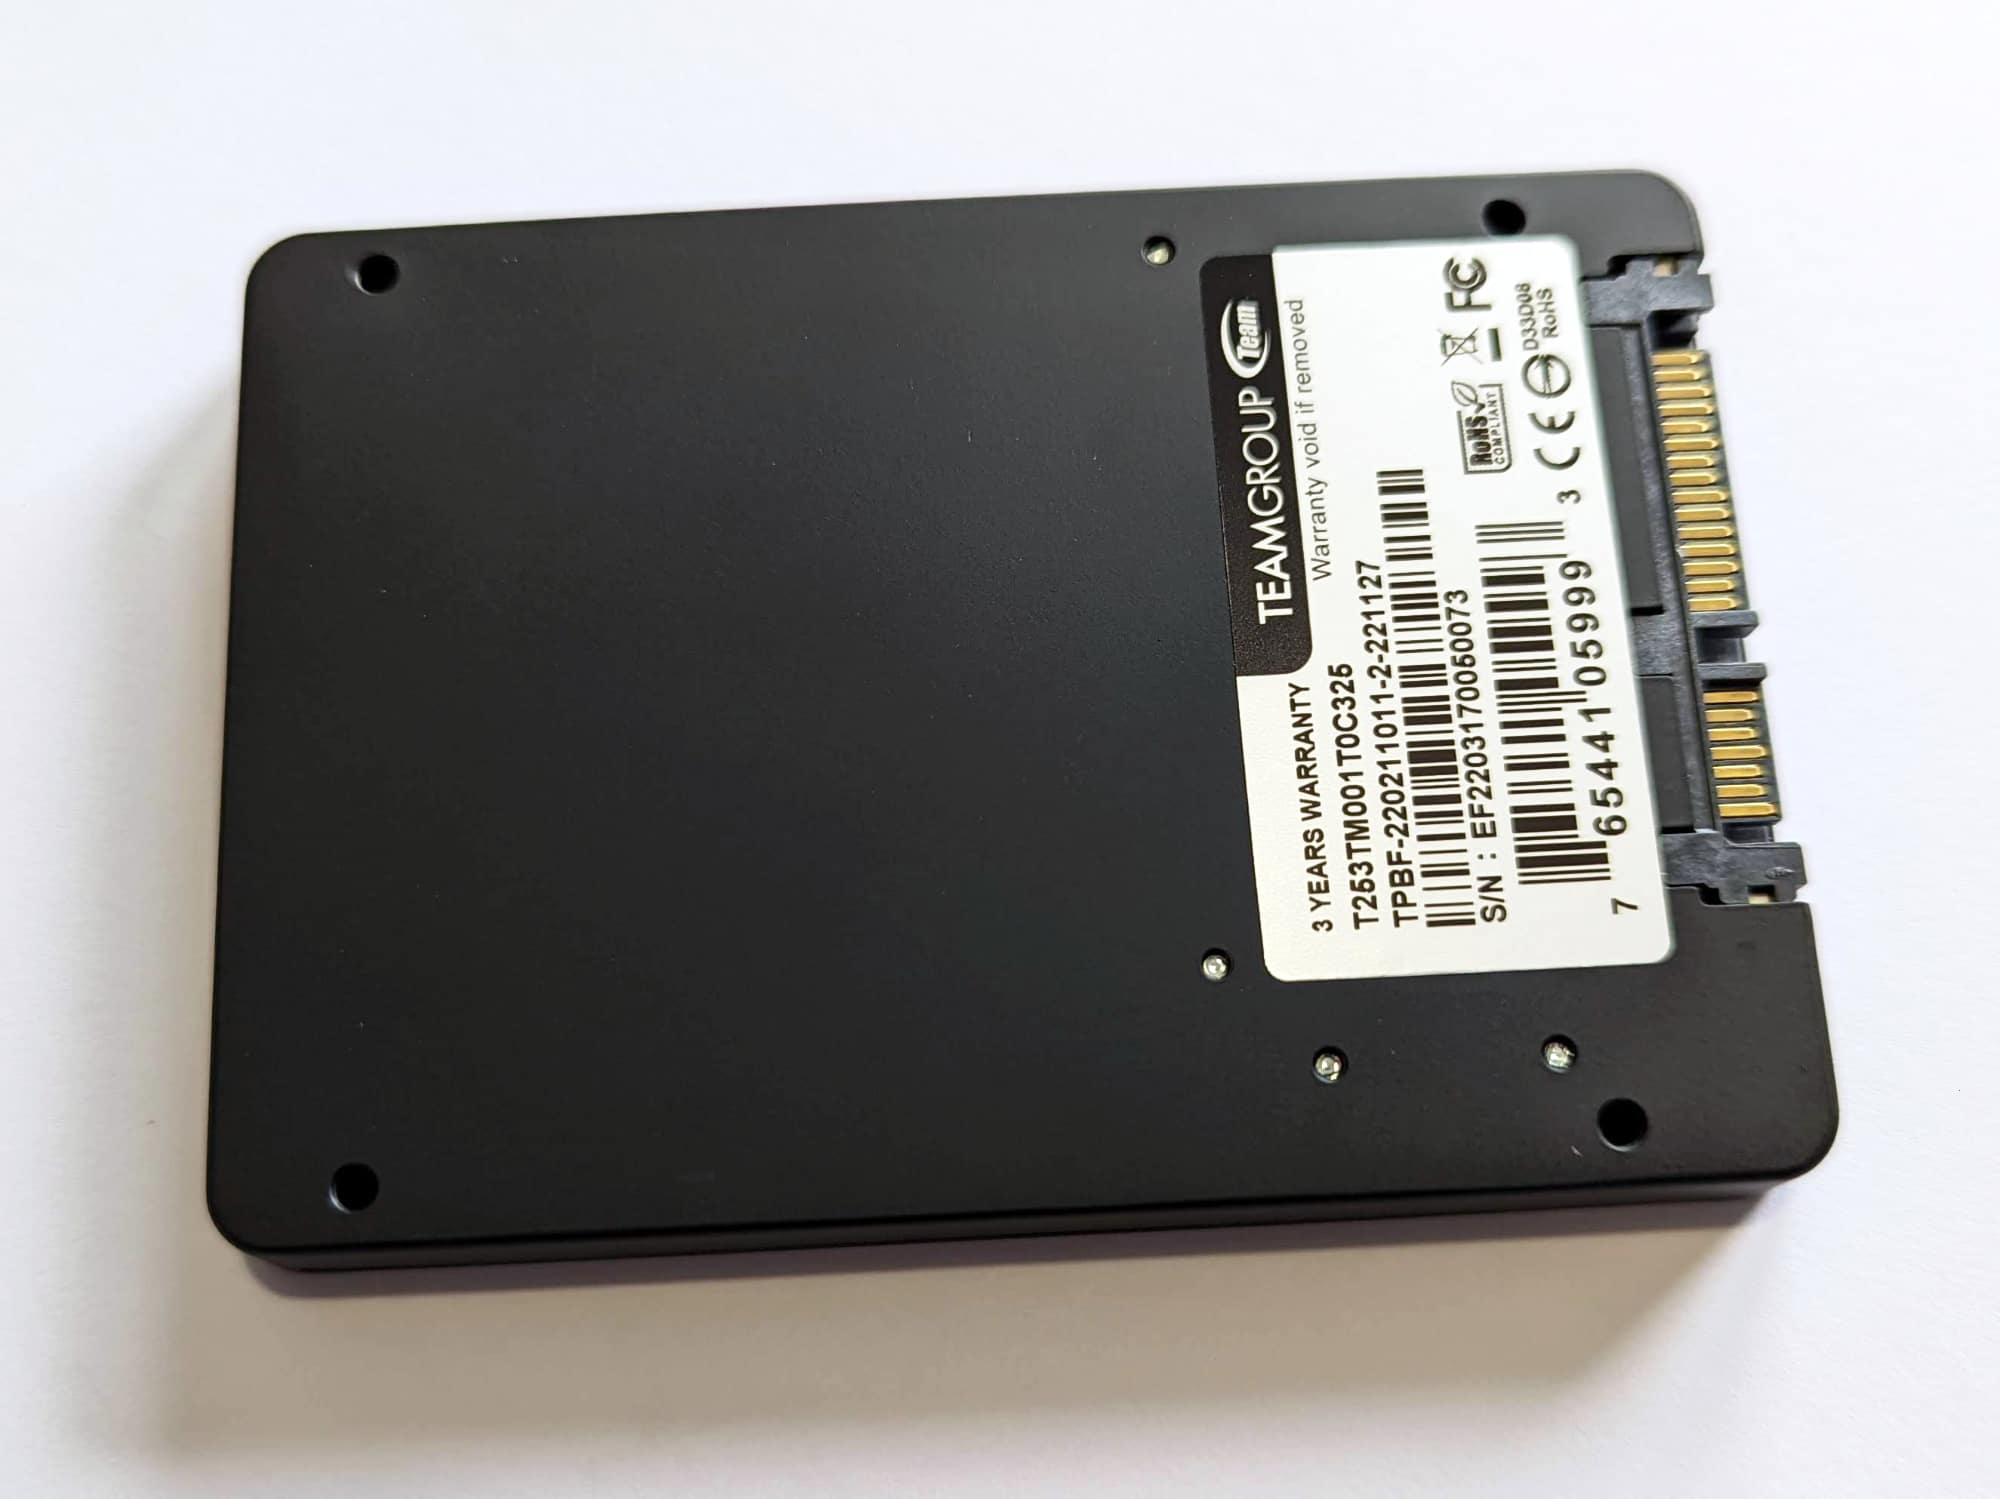
When unlit, the front of the SSD is black and slightly reflective. Furthermore, a large T-Force logo is placed in the center and a Delta MAX lettering in the lower right corner. The rest of the SSD is also completely black, apart from a white sticker with the exact name, serial number and warranty period, which is on the back of the SSD. Even without RGB lighting, the SSD is visually very appealing and clearly stands out from the mass of SATA SSDs.
TeamGroup offers two options to control the RGB lighting. On the one hand, a USB 10-pin to USB Micro-B cable is included, which only enables the rainbow effect, but on the other hand, a three-pin 5V ARGB to USB Micro-B cable is also included. If your mainboard has a 5V-ARGB connector, you can use it to control the effects yourself. The selection is done via the software of the motherboard manufacturer. Asus, Gigabyte, Biostar, ASRock and MSI are supported. Of course, this also allows synchronization with other installed RGB components.


The extensive RGB lighting leaves a very good impression on us. The colors and color gradients are very good, and the logo and lettering also form an appealing contrast. If you have the right case, you can visually upgrade your system even more with the Delta MAX LITE RGB. Furthermore, RGB does not have any noticeable negative effects on the SSD’s temperature. At summer room temperatures of 26°C, we reached a maximum of 46°C under load.
Test system
- ASUS ROG Strix B560-F Gaming WiFi Motherboard
- Intel Core i5-11400F processor
- 32GB G.Skill RipJaws V 3200 RAM
- INNO3D GeForce RTX 3060 Twin X2 graphics card
- Kingston KC3000 1TB SSD
- Crucial P5 2TB SSD
- Crucail MX500 4TB SSD
- Seasonic Focus GX-550 power supply
Performance test
For the performance test, we use our usual benchmark course with the programs AS SSD, CrystalDiskMark, ATTO Disk and HD Tune Pro.
Results of the performance test
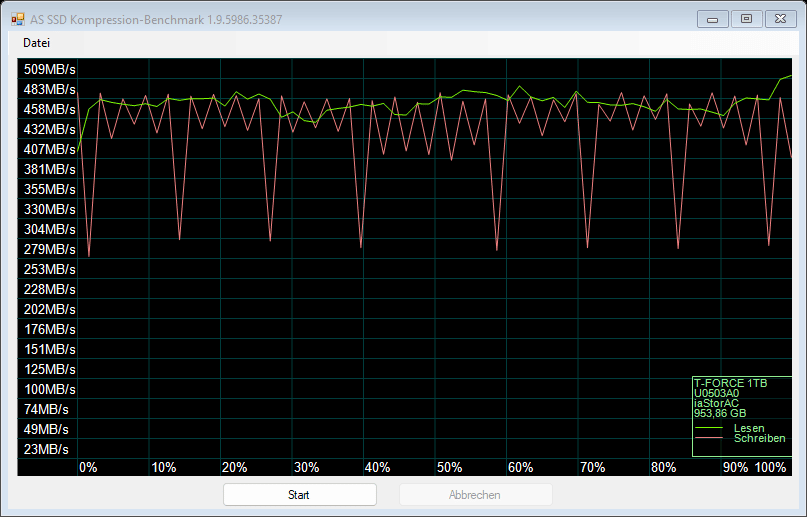
In the AS SSD benchmark, the SSD lands at the back of the pack in sequential read and write. However, it has to be taken into account here that most current SATA SSDs offer a similar performance and the spectrum is significantly smaller than that of PCIe SSDs. While the 4K performance is very good in writing, the Delta MAX LITE RGB is clearly beaten by most of the previously tested SSDs in reading. A similar picture is seen in the other tests of the AS SSD benchmark. In the benchmark score, the SSD is only in last place, but in the copy benchmark, it is at least in the midfield of the SATA SSDs we have tested so far.
In CrystalDiskMark, we achieved 527.31 MB/s in sequential read and 475.03 MB/s in sequential write. This is 4% and 5% below TeamGroup’s specifications of 550 and 500 MB/s, respectively, in relative terms. In the benchmark’s 4K tests, the SSD mostly lands on the back places, as already in the AS SSD benchmark, but offers good performance in 4K writes.
The result of the ATTO disk benchmark, on the other hand, is good. The chart clearly shows that the SATA interface is often limiting here and thus the majority of SSDs achieve very similar results, especially in the larger blocks. The SSD ends up in the midfield in both tests. The gap to the top in read mode is only small, in write mode as well, although some of the SSDs in the test field fall behind the Delta MAX LITE RGB. The TeamGroup SSD is at the back of the pack in terms of access time, but achieves a very good result in the HD Tune benchmark.
Overall, the SSD’s performance is often in the lower range. Especially due to the mostly low 4K performance, apart from writing, we would therefore rather recommend the Delta MAX LITE RGB as a fast storage for games or data. For the OS and software, on the other hand, we would advise a higher-performance model.
| wdt_ID | SSD | Seq (lesen, MB/s) | Seq (schreiben, MB/s) | 4K (lesen, MB/s) | 4K (schreiben, MB/s) | 4K-64-Thrd (lesen, MB/s) | 4K-64-Thrd (schreiben, MB/s) |
|---|---|---|---|---|---|---|---|
| 1 | Toshiba Q300 Pro 1TB | 506,29 | 468,26 | 20,07 | 83,41 | 353,98 | 228,57 |
| 2 | Crucial BX300 480 GB | 516,37 | 472,97 | 32,40 | 113,85 | 376,93 | 349,97 |
| 3 | Samsung SSD 860 PRO 1 TB | 526,20 | 498,49 | 45,57 | 129,23 | 377,11 | 340,89 |
| 4 | Samsung SSD 860 EVO 1 TB | 528,46 | 498,50 | 43,69 | 130,20 | 378,80 | 342,79 |
| 5 | SanDisk Ultra 3D 500 GB | 489,92 | 496,99 | 36,36 | 88,72 | 373,74 | 334,34 |
| 7 | Toshiba TR200 960 GB | 463,37 | 371,80 | 27,40 | 70,12 | 268,58 | 168,03 |
| 8 | Verbatim Vi560 S3 512 GB | 522,71 | 460,83 | 15,56 | 92,66 | 205,45 | 220,96 |
| 9 | Samsung SSD 870 QVO 1 TB | 523,80 | 494,89 | 35,53 | 96,22 | 368,67 | 331,16 |
| 10 | LC-Power Phoenix 480 GB | 517,78 | 401,51 | 24,52 | 70,22 | 238,72 | 226,73 |
| 11 | Samsung SSD 870 EVO 2 TB | 526,54 | 493,04 | 37,07 | 90,57 | 372,59 | 337,20 |
| SSD | Seq (lesen, MB/s) | Seq (schreiben, MB/s) | 4K (lesen, MB/s) | 4K (schreiben, MB/s) | 4K-64-Thrd (lesen, MB/s) | 4K-64-Thrd (schreiben, MB/s) |
| wdt_ID | SSD | Lesen | Schreiben | Gesamt |
|---|---|---|---|---|
| 1 | Toshiba Q300 Pro 1TB | 425 | 359 | 1.004 |
| 2 | Crucial BX300 480 GB | 461 | 511 | 1.217 |
| 3 | Samsung SSD 860 PRO 1 TB | 474 | 520 | 1.252 |
| 4 | Samsung SSD 860 EVO 1 TB | 475 | 523 | 1.256 |
| 5 | SanDisk Ultra 3D 500 GB | 459 | 473 | 1.180 |
| 7 | Toshiba TR200 960 GB | 342 | 275 | 798 |
| 8 | Verbatim Vi560 S3 512 GB | 273 | 360 | 774 |
| 9 | Samsung SSD 870 QVO 1 TB | 457 | 477 | 1.178 |
| 10 | LC-Power Phoenix 480 GB | 315 | 337 | 816 |
| 11 | Samsung SSD 870 EVO 2 TB | 461 | 477 | 1.183 |
| SSD | Lesen | Schreiben | Gesamt |
| wdt_ID | SSD | ISO (in MB/s) | Programm (in MB/s) | Spiel (in MB/s) |
|---|---|---|---|---|
| 1 | Toshiba Q300 Pro 1TB | 380,64 | 193,10 | 244,38 |
| 2 | Crucial BX300 480 GB | 257,05 | 105,71 | 183,26 |
| 3 | Samsung SSD 860 PRO 1 TB | 475,42 | 328,58 | 456,63 |
| 4 | Samsung SSD 860 EVO 1 TB | 460,70 | 327,49 | 440,99 |
| 5 | SanDisk Ultra 3D 500 GB | 561,93 | 416,23 | 505,09 |
| 7 | Toshiba TR200 960 GB | 252,77 | 131,44 | 146,53 |
| 8 | Verbatim Vi560 S3 512 GB | 267,41 | 109,81 | 196,38 |
| 9 | Samsung SSD 870 QVO 1 TB | 269,89 | 118,24 | 243,96 |
| 10 | LC-Power Phoenix 480 GB | 215,69 | 103,90 | 186,73 |
| 11 | Samsung SSD 870 EVO 2 TB | 472,84 | 309,70 | 438,83 |
| SSD | ISO (in MB/s) | Programm (in MB/s) | Spiel (in MB/s) |
| wdt_ID | SSD | Seq Q32T1 (lesen, in MB/s) | Seq Q32T1 (schreiben, in MB/s) | 4K Q32T1 (lesen, in MB/s) | 4K Q32T1 (schreiben, in MB/s) | Seq (lesen, in MB/s) | Seq (schreiben, in MB/s) | 4K (lesen, in MB/s) | 4K (schreiben, in MB/s) |
|---|---|---|---|---|---|---|---|---|---|
| 1 | Toshiba Q300 Pro 1TB | 544,40 | 504,50 | 347,90 | 334,30 | 522,80 | 483,40 | 26,93 | 96,19 |
| 2 | Crucial BX300 480 GB | 552,90 | 514,20 | 377,20 | 356,30 | 535,30 | 499,10 | 32,73 | 143,10 |
| 3 | Samsung SSD 860 PRO 1 TB | 560,40 | 529,40 | 398,40 | 357,20 | 537,90 | 514,80 | 49,47 | 151,30 |
| 4 | Samsung SSD 860 EVO 1 TB | 562,20 | 533,10 | 403,10 | 359,00 | 551,30 | 522,80 | 48,49 | 155,00 |
| 5 | SanDisk Ultra 3D 500 GB | 563,00 | 534,10 | 394,70 | 361,10 | 294,10 | 276,90 | 40,71 | 110,60 |
| 6 | Toshiba TR200 960 GB | 549,60 | 519,80 | 307,90 | 256,00 | 483,40 | 398,60 | 29,31 | 79,30 |
| 7 | Verbatim Vi560 S3 512 GB | 560,50 | 373,10 | 252,80 | 189,30 | 507,50 | 372,70 | 24,52 | 91,99 |
| 8 | Samsung SSD 870 QVO 1 TB | 560,00 | 529,10 | 295,10 | 299,10 | 533,50 | 501,10 | 35,77 | 97,54 |
| 9 | LC-Power Phoenix 480 GB | 520,00 | 442,80 | 248,30 | 219,60 | 440,80 | 436,90 | 27,14 | 61,66 |
| 10 | Samsung SSD 870 EVO 2 TB | 561,40 | 528,90 | 312,80 | 284,50 | 542,20 | 503,00 | 42,89 | 93,74 |
| SSD | Seq Q32T1 (lesen, in MB/s) | Seq Q32T1 (schreiben, in MB/s) | 4K Q32T1 (lesen, in MB/s) | 4K Q32T1 (schreiben, in MB/s) | Seq (lesen, in MB/s) | Seq (schreiben, in MB/s) | 4K (lesen, in MB/s) | 4K (schreiben, in MB/s) |
| wdt_ID | SSD | 512 B | 1 KB | 2 KB | 4 KB | 8 KB | 16 KB | 32 KB | 64 KB | 128 KB | 256 KB | 512 KB | 1 MB | 2 MB | 4 MB | 8 MB | 12 MB | 16 MB | 24 MB | 32 MB | 48 MB | 64 MB |
|---|---|---|---|---|---|---|---|---|---|---|---|---|---|---|---|---|---|---|---|---|---|---|
| 5 | Toshiba Q300 Pro 1 TB | 6.194 | 13.212 | 24.778 | 93.499 | 143.382 | 223.665 | 283.402 | 343.344 | 404.103 | 438.584 | 467.424 | 479.349 | 482.580 | 478.281 | 481.498 | 482.031 | 479.349 | 480.835 | 481.498 | 481.532 | 481.498 |
| 6 | Crucial BX300 480 GB | 17.920 | 32.859 | 65.024 | 115.423 | 183.402 | 277.142 | 330.095 | 391.259 | 445.390 | 478.801 | 476.625 | 488.846 | 491.136 | 488.846 | 486.578 | 487.709 | 486.437 | 486.672 | 488.704 | 490.252 | 489.385 |
| 7 | Samsung SSD 860 PRO 1 TB | 21.833 | 41.984 | 78.140 | 136.192 | 210.417 | 303.104 | 385.505 | 442.368 | 477.203 | 499.321 | 514.007 | 517.815 | 521.679 | 516.539 | 517.495 | 516.752 | 514.165 | 516.327 | 515.112 | 516.940 | 516.687 |
| 8 | Samsung SSD 860 EVO 1 TB | 21.248 | 40.960 | 75.399 | 122.880 | 213.439 | 291.992 | 377.474 | 437.988 | 468.114 | 493.447 | 507.784 | 512.751 | 515.270 | 513.378 | 511.188 | 511.292 | 512.281 | 511.292 | 511.812 | 511.783 | 511.991 |
| 9 | SanDisk Ultra 3D 500 GB | 31.490 | 61.280 | 124.510 | 250.980 | 392.580 | 489.740 | 515.630 | 528.610 | 535.710 | 536.990 | 479.620 | 497.510 | 537.630 | 536.910 | 537.270 | 535.480 | 534.580 | 533.690 | 527.360 | 534.730 | 534.810 |
| 10 | Toshiba TR200 960 GB | 10.518 | 20.327 | 40.448 | 99.852 | 172.356 | 234.635 | 352.256 | 409.600 | 473.754 | 480.998 | 504.123 | 472.331 | 460.912 | 464.485 | 480.172 | 486.578 | 485.873 | 487.143 | 488.206 | 489.763 | 492.542 |
| 11 | Verbatim Vi560 S3 512 GB | 10.086 | 17.698 | 38.114 | 70.970 | 117.899 | 187.478 | 220.632 | 291.992 | 326.862 | 359.101 | 434.192 | 469.161 | 486.578 | 498.135 | 505.033 | 506.966 | 508.863 | 509.842 | 509.326 | 510.415 | 386.846 |
| 12 | Samsung SSD 870 QVO 1 TB | 15.360 | 29.952 | 56.690 | 102.654 | 171.602 | 253.318 | 330.908 | 349.102 | 401.871 | 455.336 | 493.447 | 502.914 | 505.337 | 501.711 | 502.612 | 500.712 | 506.100 | 508.708 | 506.941 | 509.734 | 510.697 |
| 13 | LC-Power Phoenix 480 GB | 11.080 | 20.378 | 41.671 | 66.064 | 114.401 | 200.704 | 281.788 | 312.076 | 373.601 | 443.238 | 484.330 | 483.214 | 471.270 | 502.311 | 493.447 | 508.195 | 502.311 | 508.297 | 509.403 | 509.432 | 510.166 |
| 14 | Samsung SSD 870 EVO 2 TB | 14.208 | 27.068 | 51.200 | 96.804 | 166.154 | 228.286 | 276.627 | 321.126 | 367.393 | 432.507 | 481.498 | 494.811 | 498.256 | 501.748 | 504.104 | 504.462 | 505.290 | 504.462 | 506.481 | 506.937 | 506.481 |
| SSD | 512 B | 1 KB | 2 KB | 4 KB | 8 KB | 16 KB | 32 KB | 64 KB | 128 KB | 256 KB | 512 KB | 1 MB | 2 MB | 4 MB | 8 MB | 12 MB | 16 MB | 24 MB | 32 MB | 48 MB | 64 MB |
| wdt_ID | SSD | 512 B | 1 KB | 2 KB | 4 KB | 8 KB | 16 KB | 32 KB | 64 KB | 128 KB | 256 KB | 512 KB | 1 MB | 2 MB | 4 MB | 8 MB | 12 MB | 16 MB | 24 MB | 32 MB | 48 MB | 64 MB |
|---|---|---|---|---|---|---|---|---|---|---|---|---|---|---|---|---|---|---|---|---|---|---|
| 5 | Toshiba Q300 Pro 1 TB | 12.288 | 26.425 | 50.688 | 88.969 | 131.657 | 216.627 | 293.011 | 354.146 | 406.935 | 444.835 | 468.590 | 480.421 | 484.759 | 486.957 | 492.542 | 488.872 | 492.542 | 489.954 | 490.293 | 490.470 | 492.542 |
| 6 | Crucial BX300 480 GB | 16.302 | 29.802 | 55.158 | 91.701 | 124.616 | 155.847 | 176.690 | 370.350 | 207.580 | 218.453 | 243.289 | 246.144 | 302.183 | 381.647 | 420.481 | 446.677 | 458.018 | 472.242 | 476.354 | 477.849 | 480.488 |
| 7 | Samsung SSD 860 PRO 1 TB | 21.067 | 40.091 | 74.240 | 131.766 | 212.460 | 304.158 | 387.404 | 444.311 | 483.066 | 504.123 | 515.270 | 520.385 | 524.288 | 526.922 | 524.615 | 524.506 | 524.124 | 523.960 | 524.369 | 524.192 | 524.016 |
| 8 | Samsung SSD 860 EVO 1 TB | 20.428 | 39.737 | 74.240 | 116.155 | 213.970 | 300.847 | 377.474 | 443.238 | 480.704 | 504.123 | 515.270 | 521.679 | 525.602 | 526.261 | 525.272 | 525.602 | 525.766 | 525.821 | 525.684 | 526.359 | 526.989 |
| 9 | SanDisk Ultra 3D 500 GB | 18.460 | 36.440 | 120.610 | 216.800 | 355.470 | 450.870 | 458.640 | 489.000 | 509.590 | 496.280 | 503.020 | 503.360 | 489.000 | 510.200 | 466.200 | 423.580 | 425.420 | 424.400 | 424.570 | 424.830 | 425.890 |
| 10 | Toshiba TR200 960 GB | 13.952 | 21.291 | 33.224 | 74.380 | 105.966 | 126.030 | 171.176 | 188.141 | 193.702 | 197.471 | 257.003 | 501.711 | 321.156 | 341.277 | 263.958 | 244.518 | 263.254 | 251.935 | 249.123 | 248.852 | 247.121 |
| 11 | Verbatim Vi560 S3 512 GB | 15.577 | 29.952 | 56.039 | 101.890 | 163.840 | 255.493 | 317.109 | 321.254 | 360.800 | 361.577 | 364.088 | 384.798 | 371.835 | 388.721 | 394.572 | 412.960 | 433.631 | 432.997 | 422.972 | 407.304 | 404.422 |
| 12 | Samsung SSD 870 QVO 1 TB | 14.720 | 28.855 | 54.511 | 100.101 | 169.560 | 254.862 | 333.371 | 354.248 | 412.575 | 459.901 | 489.988 | 505.337 | 516.539 | 518.455 | 518.455 | 518.882 | 518.579 | 520.385 | 520.950 | 519.439 | 518.637 |
| 13 | LC-Power Phoenix 480 GB | 12.323 | 21.852 | 1.777 | 18.662 | 17.266 | 19.980 | 242.128 | 338.979 | 370.958 | 418.951 | 436.906 | 442.437 | 445.255 | 443.841 | 445.018 | 443.060 | 440.346 | 439.347 | 439.366 | 439.653 | 439.102 |
| 14 | Samsung SSD 870 EVO 2 TB | 13.952 | 27.188 | 50.693 | 93.499 | 161.276 | 243.943 | 286.563 | 309.841 | 372.232 | 439.614 | 474.058 | 499.414 | 516.222 | 519.971 | 521.233 | 523.544 | 522.502 | 522.309 | 522.502 | 523.249 | 525.057 |
| SSD | 512 B | 1 KB | 2 KB | 4 KB | 8 KB | 16 KB | 32 KB | 64 KB | 128 KB | 256 KB | 512 KB | 1 MB | 2 MB | 4 MB | 8 MB | 12 MB | 16 MB | 24 MB | 32 MB | 48 MB | 64 MB |
| wdt_ID | SSD | Minimum (in MB/s) | Maximum (in MB/s) | Average (in MB/s) |
|---|---|---|---|---|
| 1 | Toshiba Q300 Pro 1TB | 298,10 | 408,00 | 351,10 |
| 2 | Crucial BX300 480 GB | 323,60 | 443,30 | 428,40 |
| 3 | Samsung SSD 860 PRO 1 TB | 438,00 | 460,30 | 456,40 |
| 4 | Samsung SSD 860 EVO 1 TB | 451,30 | 459,30 | 456,90 |
| 5 | SanDisk Ultra 3D 500 GB | 415,70 | 438,20 | 434,60 |
| 7 | Toshiba TR200 960 GB | 447,30 | 455,90 | 454,70 |
| 8 | Verbatim Vi560 S3 512 GB | 306,20 | 349,40 | 324,30 |
| 9 | Samsung SSD 870 QVO 1 TB | 353,60 | 413,90 | 373,50 |
| 10 | LC-Power Phoenix 480 GB | 337,30 | 398,10 | 365,10 |
| 11 | Samsung SSD 870 EVO 2 TB | 313,80 | 370,10 | 337,10 |
| SSD | Minimum (in MB/s) | Maximum (in MB/s) | Average (in MB/s) |
| wdt_ID | SSD | AS SSD (schreiben) | HD Tune Pro |
|---|---|---|---|
| 1 | Toshiba Q300 Pro 1TB | 0,040 | 0,070 |
| 2 | Crucial BX300 480 GB | 0,050 | 0,028 |
| 3 | Samsung SSD 860 PRO 1 TB | 0,025 | 0,028 |
| 4 | Samsung SSD 860 EVO 1 TB | 0,024 | 0,027 |
| 5 | SanDisk Ultra 3D 500 GB | 0,089 | 0,035 |
| 7 | Toshiba TR200 960 GB | 2,057 | 0,024 |
| 8 | Verbatim Vi560 S3 512 GB | 2,501 | 0,039 |
| 9 | Samsung SSD 870 QVO 1 TB | 0,345 | 0,030 |
| 10 | LC-Power Phoenix 480 GB | 2,725 | 0,031 |
| 11 | Samsung SSD 870 EVO 2 TB | 0,037 | 0,031 |
| SSD | AS SSD (schreiben) | HD Tune Pro |
Summary on the TeamGroup T-Force Delta MAX LITE review
In the end, the conclusion on the TeamGroup T-Force Delta MAX LITE RGB is mixed. If we disregard the sequential read and write rates, where most SATA SSDs achieve similar results, then the Delta MAX LITE RGB is sometimes clearly beaten by other models in most benchmarks. In addition, popular SATA SSDs with a good price-performance ratio, such as the SanDisk Ultra 3D, the Crucial MX500 or the Samsung SSD 870 EVO, are faster and significantly cheaper. If it is the only SSD in the system or the performance is of great importance, then a recommendation is difficult.
On the other hand, the Delta MAX LITE RGB offers a unique design including impressive RGB lighting that is unrivaled on the market. If the look is crucial and RGB plays a big role in the design of the system, then the only choice is between the Delta MAX LITE RGB or an SSD that is inconspicuous at best. If you only plan to use the SSD for use cases where performance is less crucial, or have a faster SSD for those, then performance is probably less of an issue. As an alternative to the Delta MAX LITE RGB, you should also look at the price of the Delta MAX RGB, which has been available for a longer time. If the surcharge is only small, then you should opt for it, the DRAM cache and the better performance.
The Delta MAX LITE RGB is especially interesting when design and RGB are in the foreground. No other SSD can keep up here. On the other hand, it looks completely different when it comes to performance. If you do not want to compromise here, you should go for one of the numerous alternatives without RGB lighting.

TeamGroup T-Force Delta MAX LITE RGB
Access times
Transfer rate (read)
Transfer rate (write)
Design
Value for money
77/100
The Delta MAX LITE RGB primarily convinces with its design, regardless of whether it has RGB lighting or not. The performance is rather disappointing, so you have to choose between these two points.