The MP34 represents Teamgroup’s new SSD – Teamgroup itself calls it “the new force” of the market. This new generation is the direct successor of the MP33, achieves higher read and write values and has thus been optimized in terms of performance.
Promised are 3000 MB/s read and 2600 MB/s write – in CrystalDiskMark. These are remarkable values for an NVMe Gen3 SSD – whether the MP34 can keep the expectations, we have tested for you.
Specifications
| Connection | M.2 PCIe NVMe gen 3 x4 (M key) |
| Form factor | M.2 2280 |
| Controller | Phison PS5012-E12-27 |
| NVMe generation | 1.3 |
| Max. read speed | 3000 MB/s |
| Max. write speed | 2600 MB/s |
| MTBF | 1.8 million hours |
| TBW | >1,660TB (1 TB) |
| Flash type | 3D-TLC NAND |
| Operating temperature | 0-70°C |
| Warranty | 5 years |
| Price | € 92.83 * |
The MP34 is supposed to bring the specified data throughput to the PC via an NVMe Gen3 x4 interface – the NVMe protocol version used here is 1.3. At first glance, the data is convincing – especially the high TBW of 1.66 PB is enormous – the SSD should thus also survive a write-intensive everyday life for a very long time. As with other SSDs of this quality class, this is aimed at enthusiasts or professional users – but the future-oriented gamer should also keep an eye on this SSD, because the high TBW should make the SSD last a very long time.


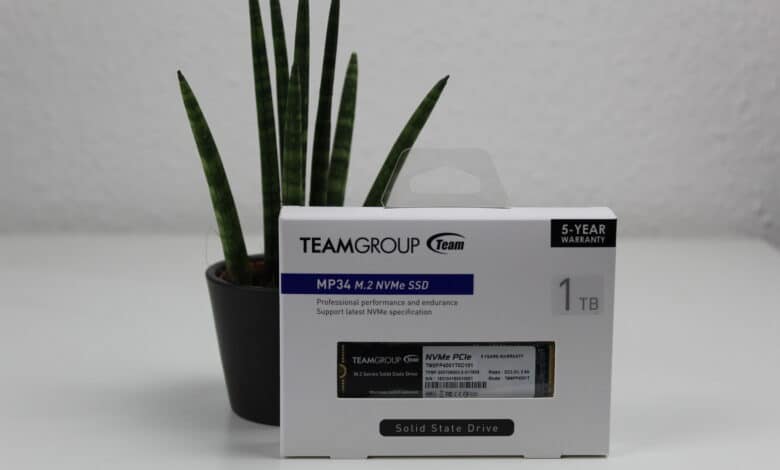
Scope of delivery
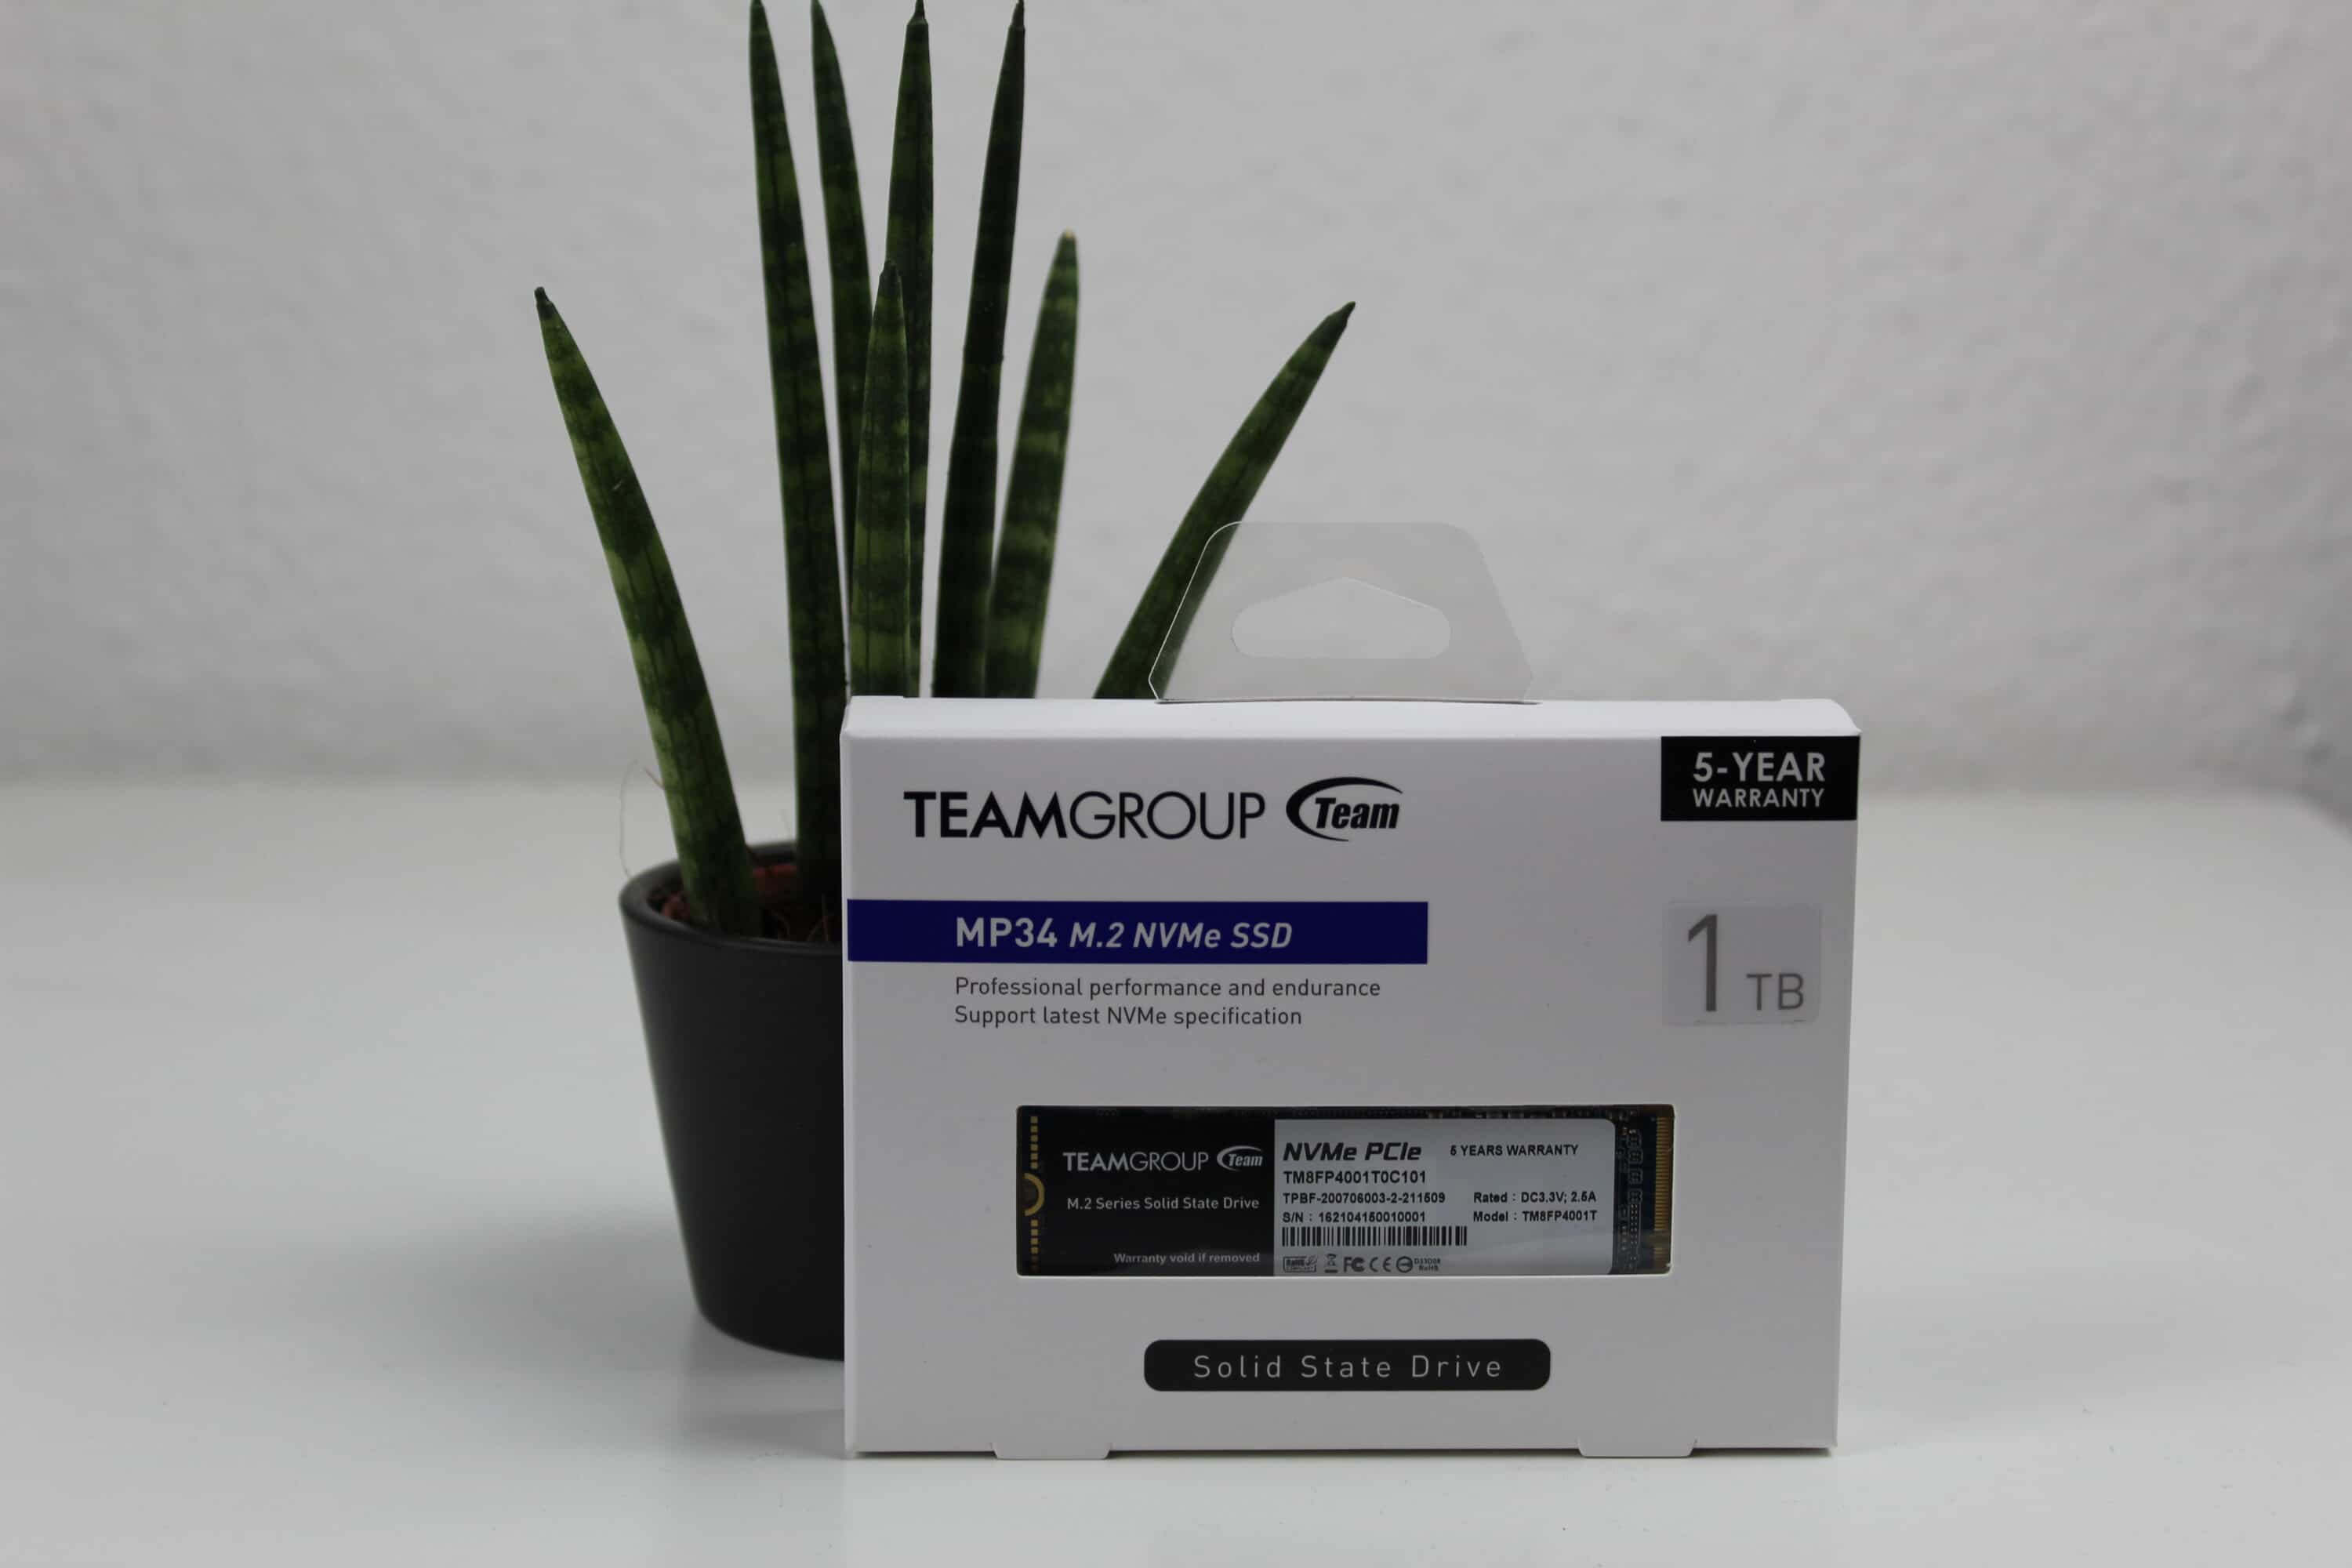
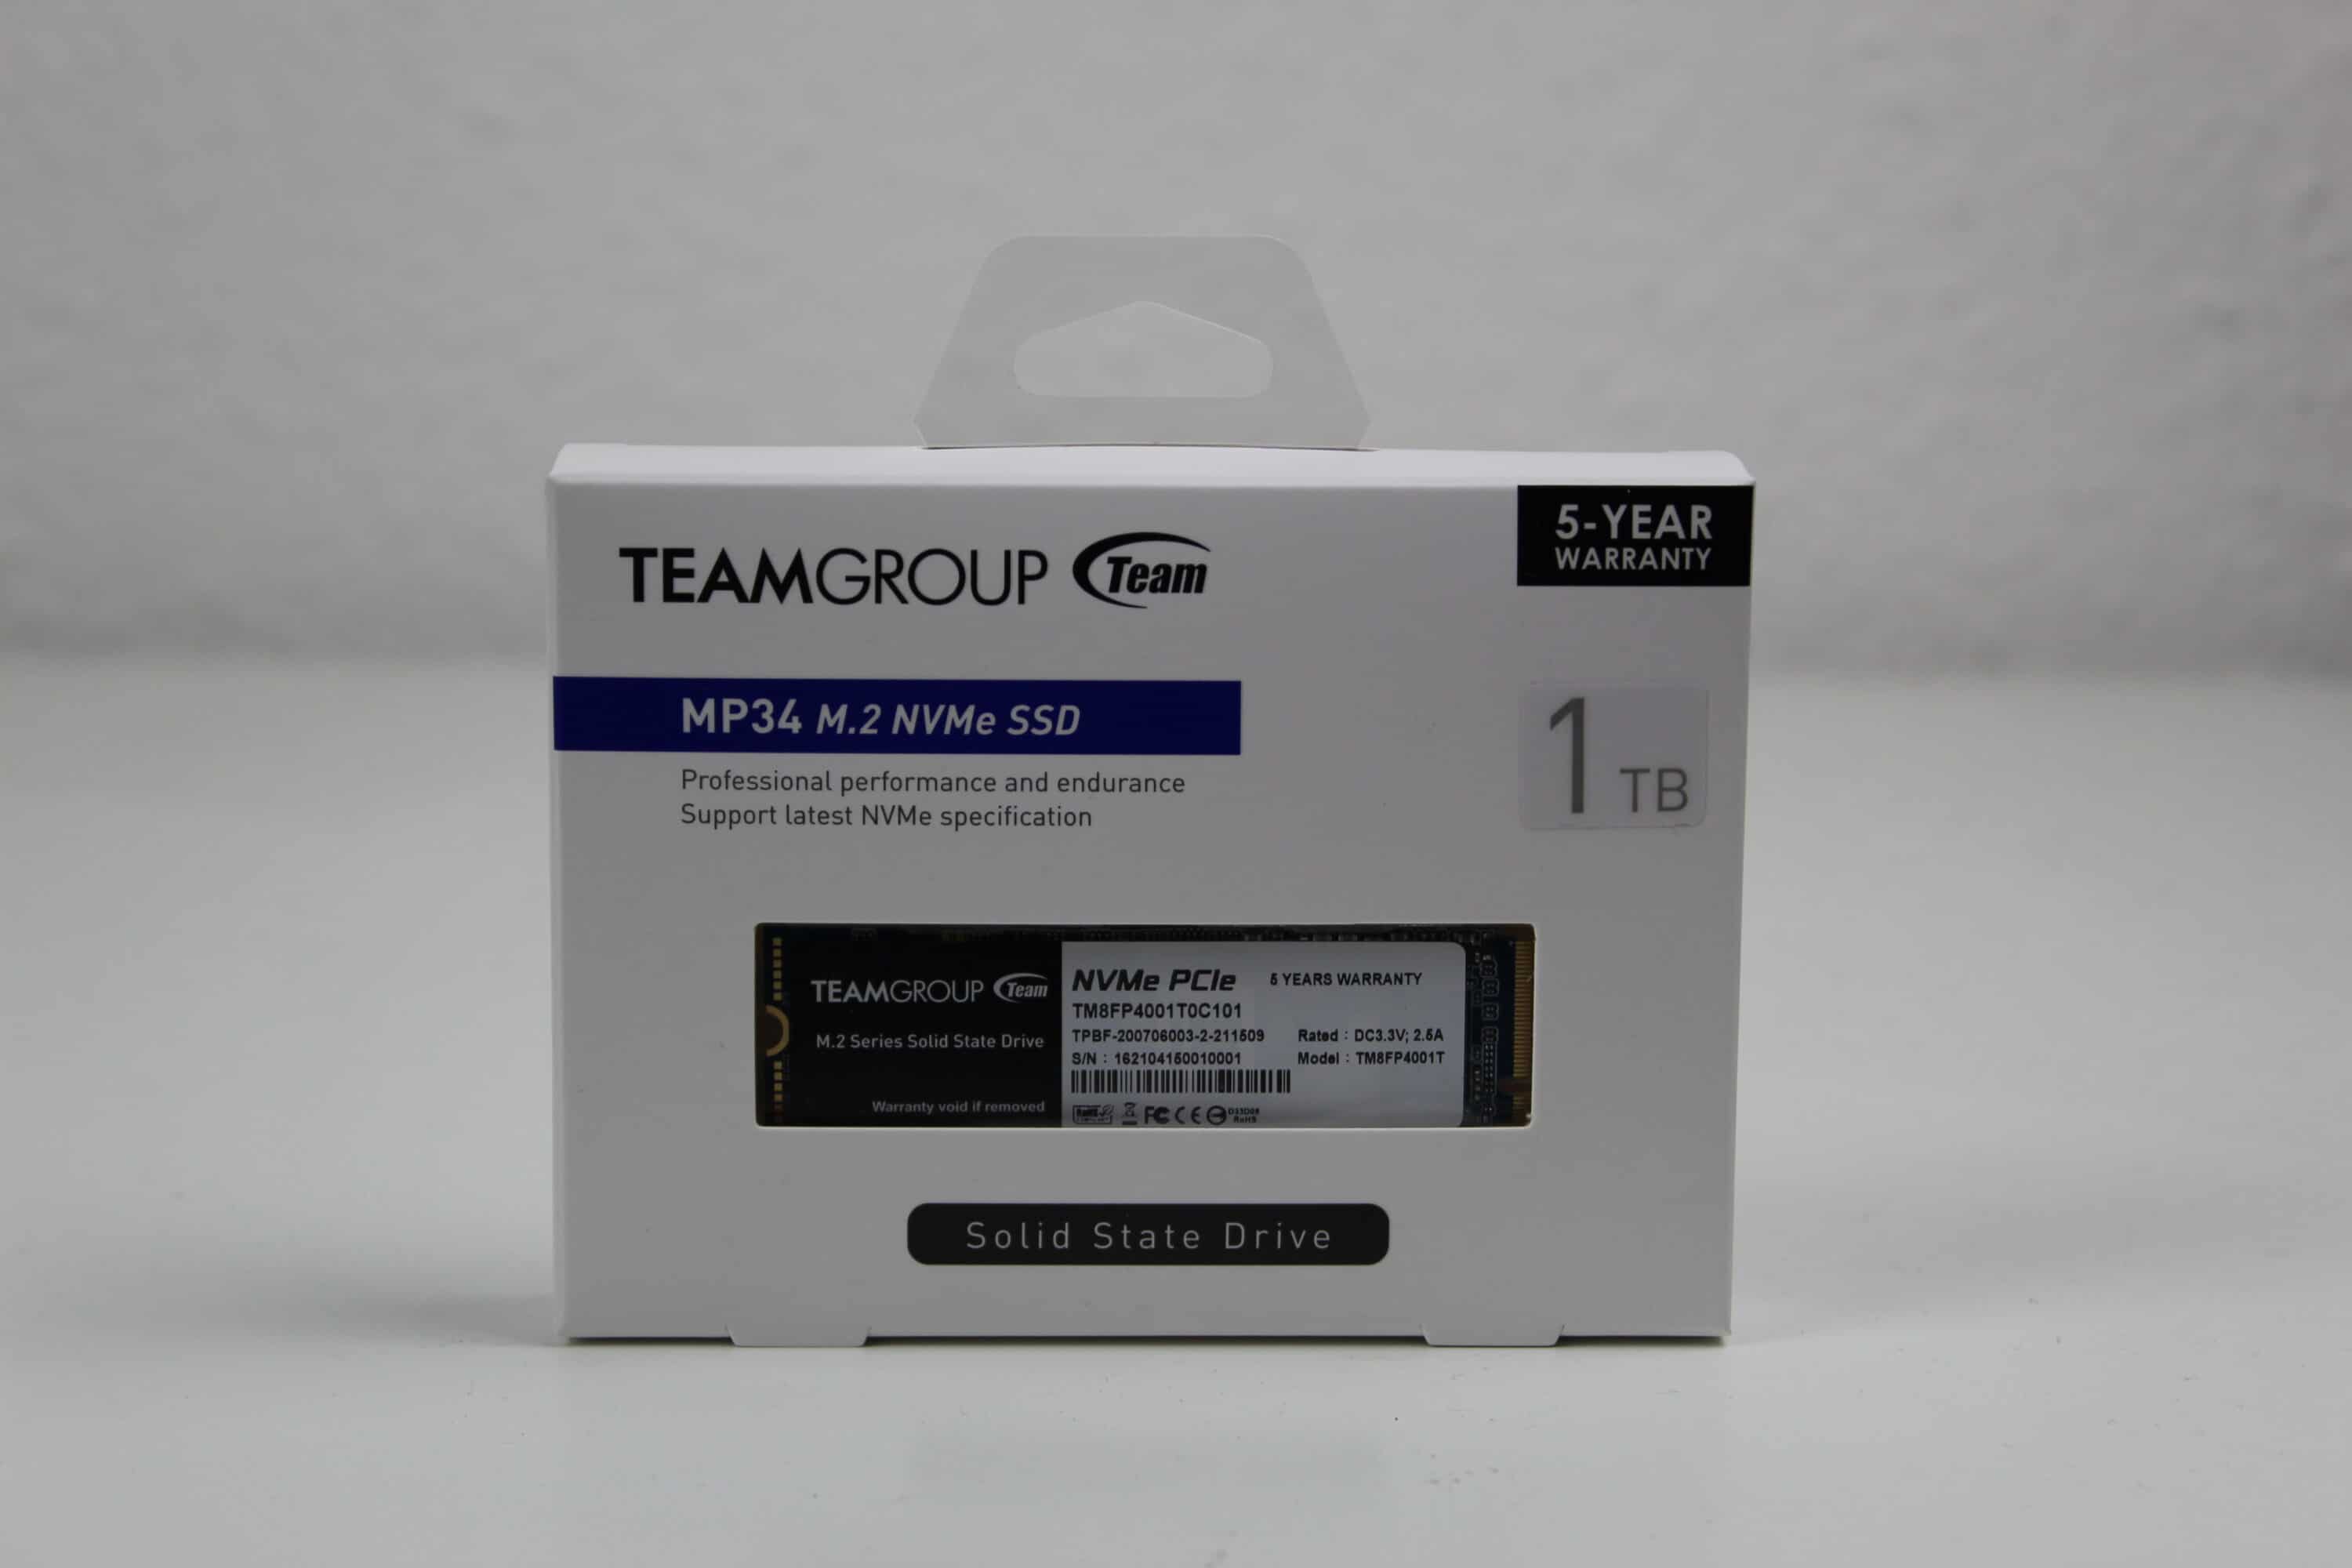
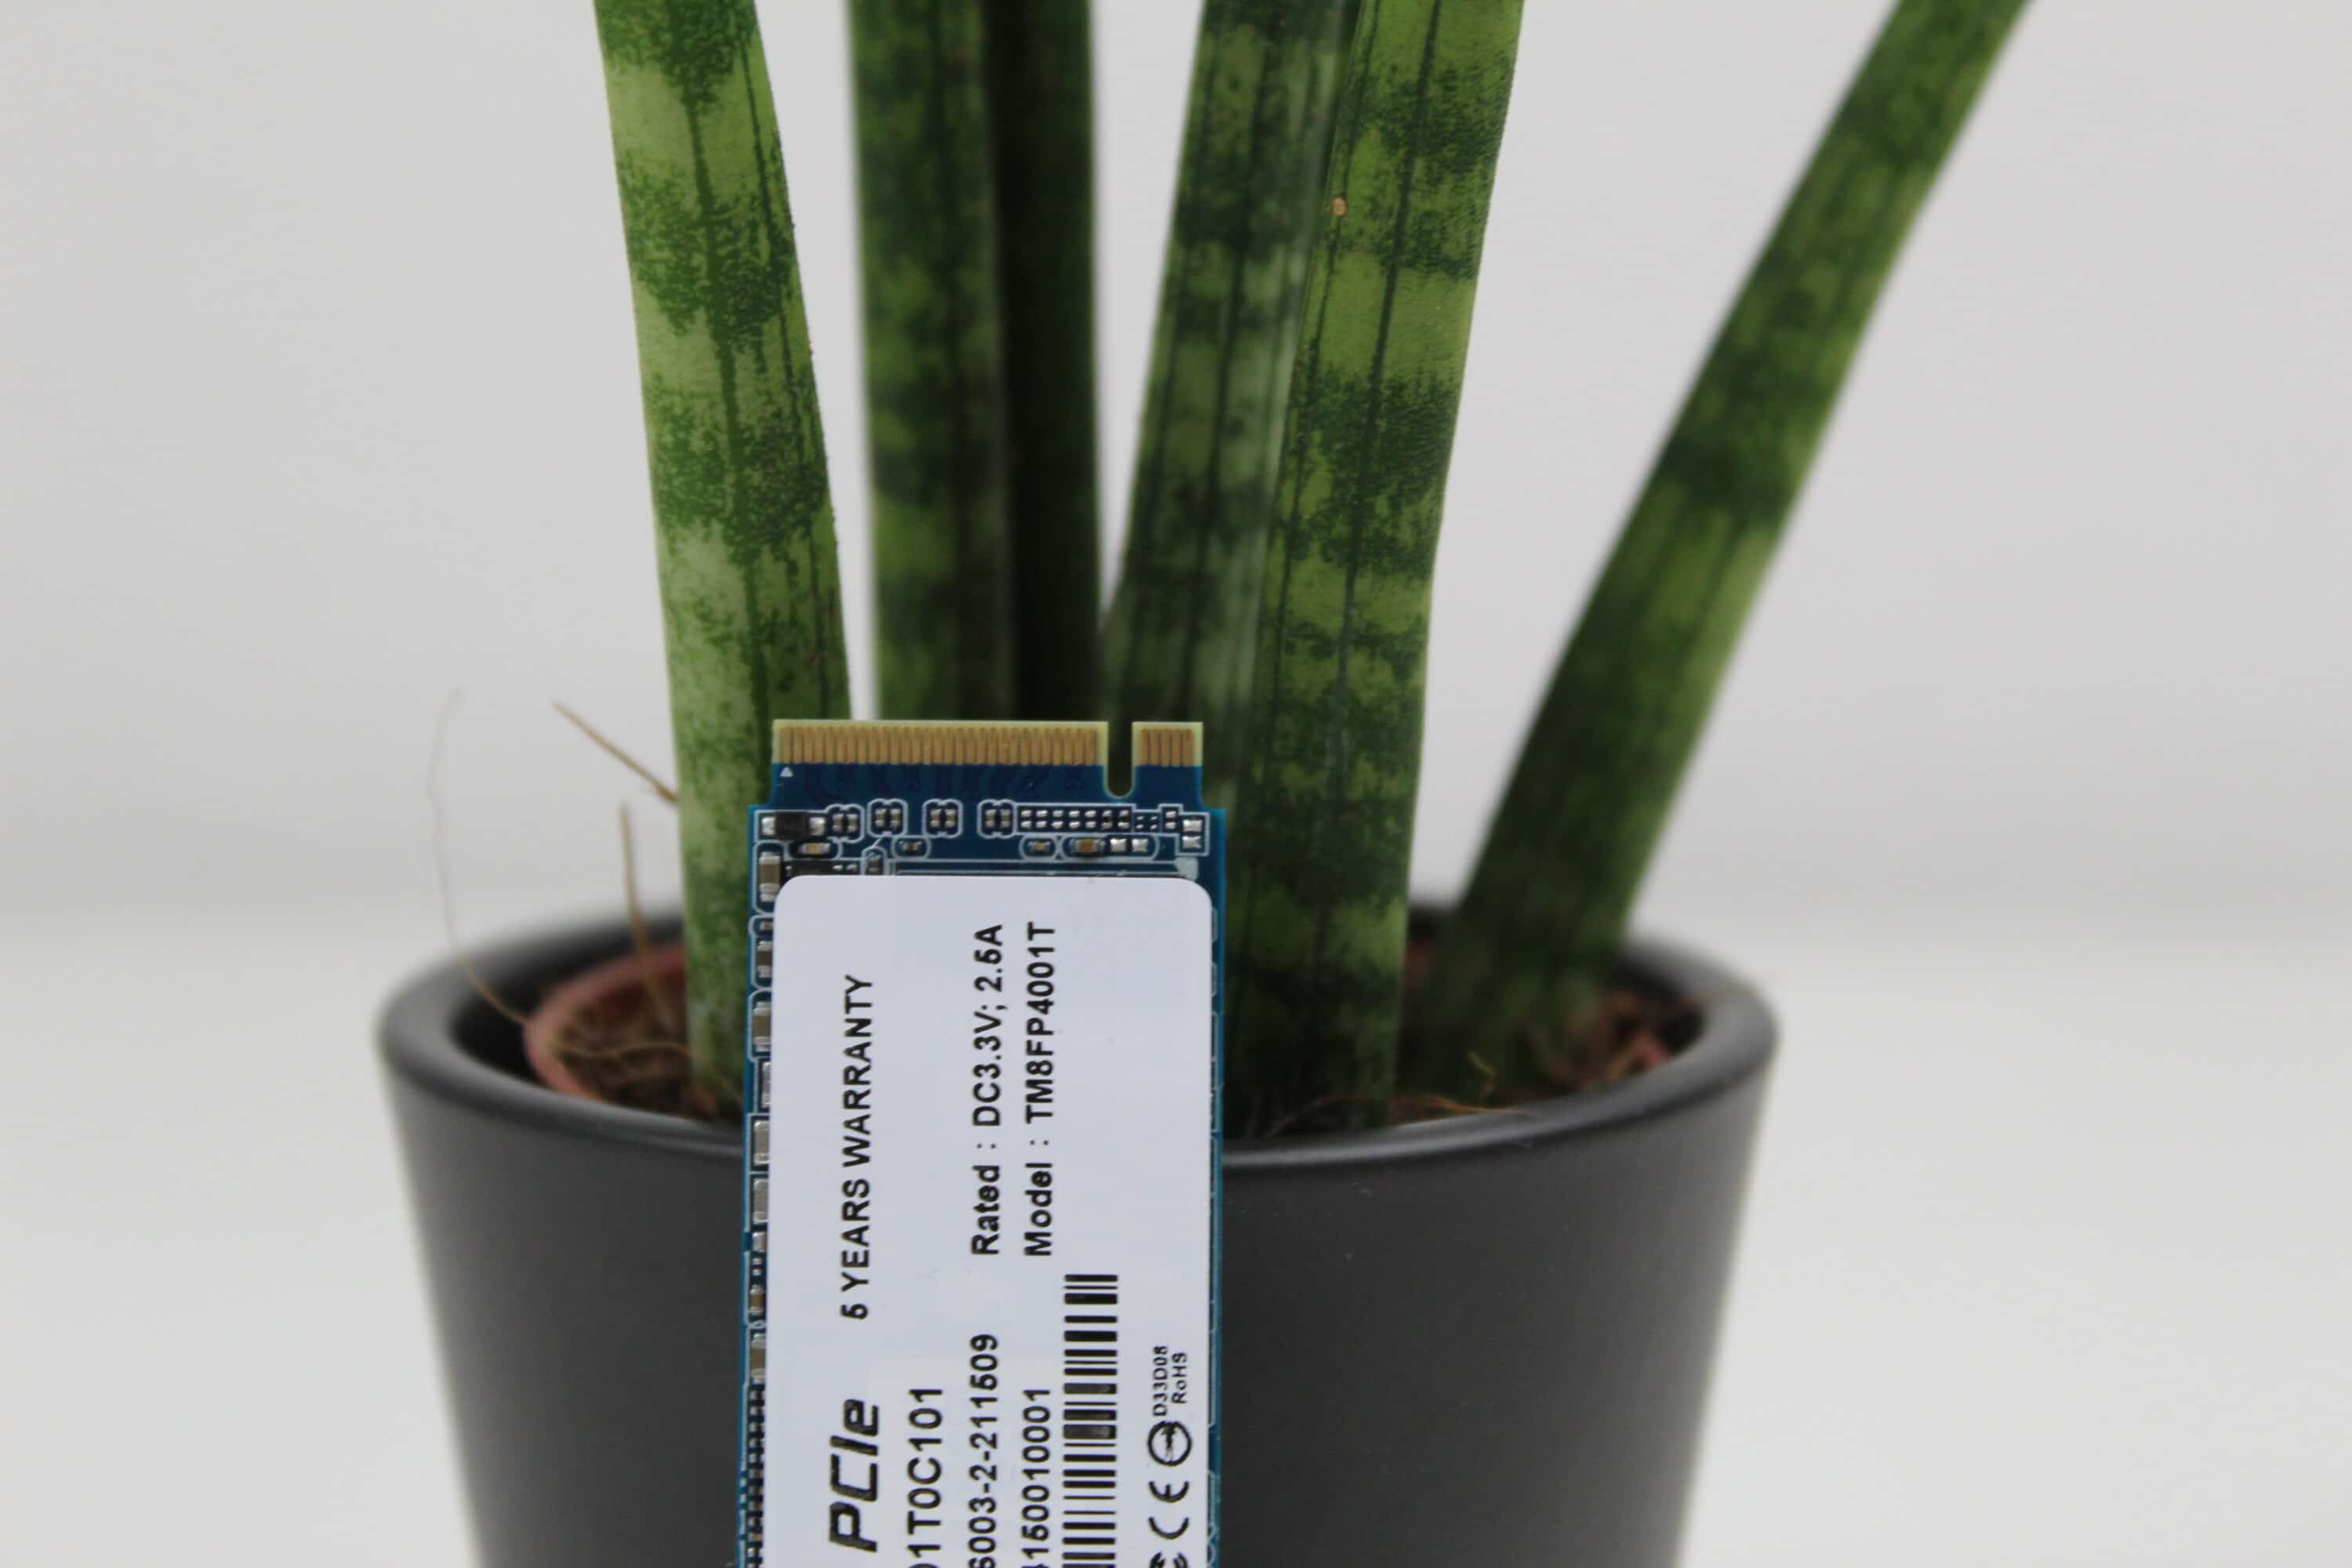
The box the SSD comes in is plain and presents the product through a plastic window. There is no “gaming look” or anything like that – the plain white cardboard box only has the product details printed on it.
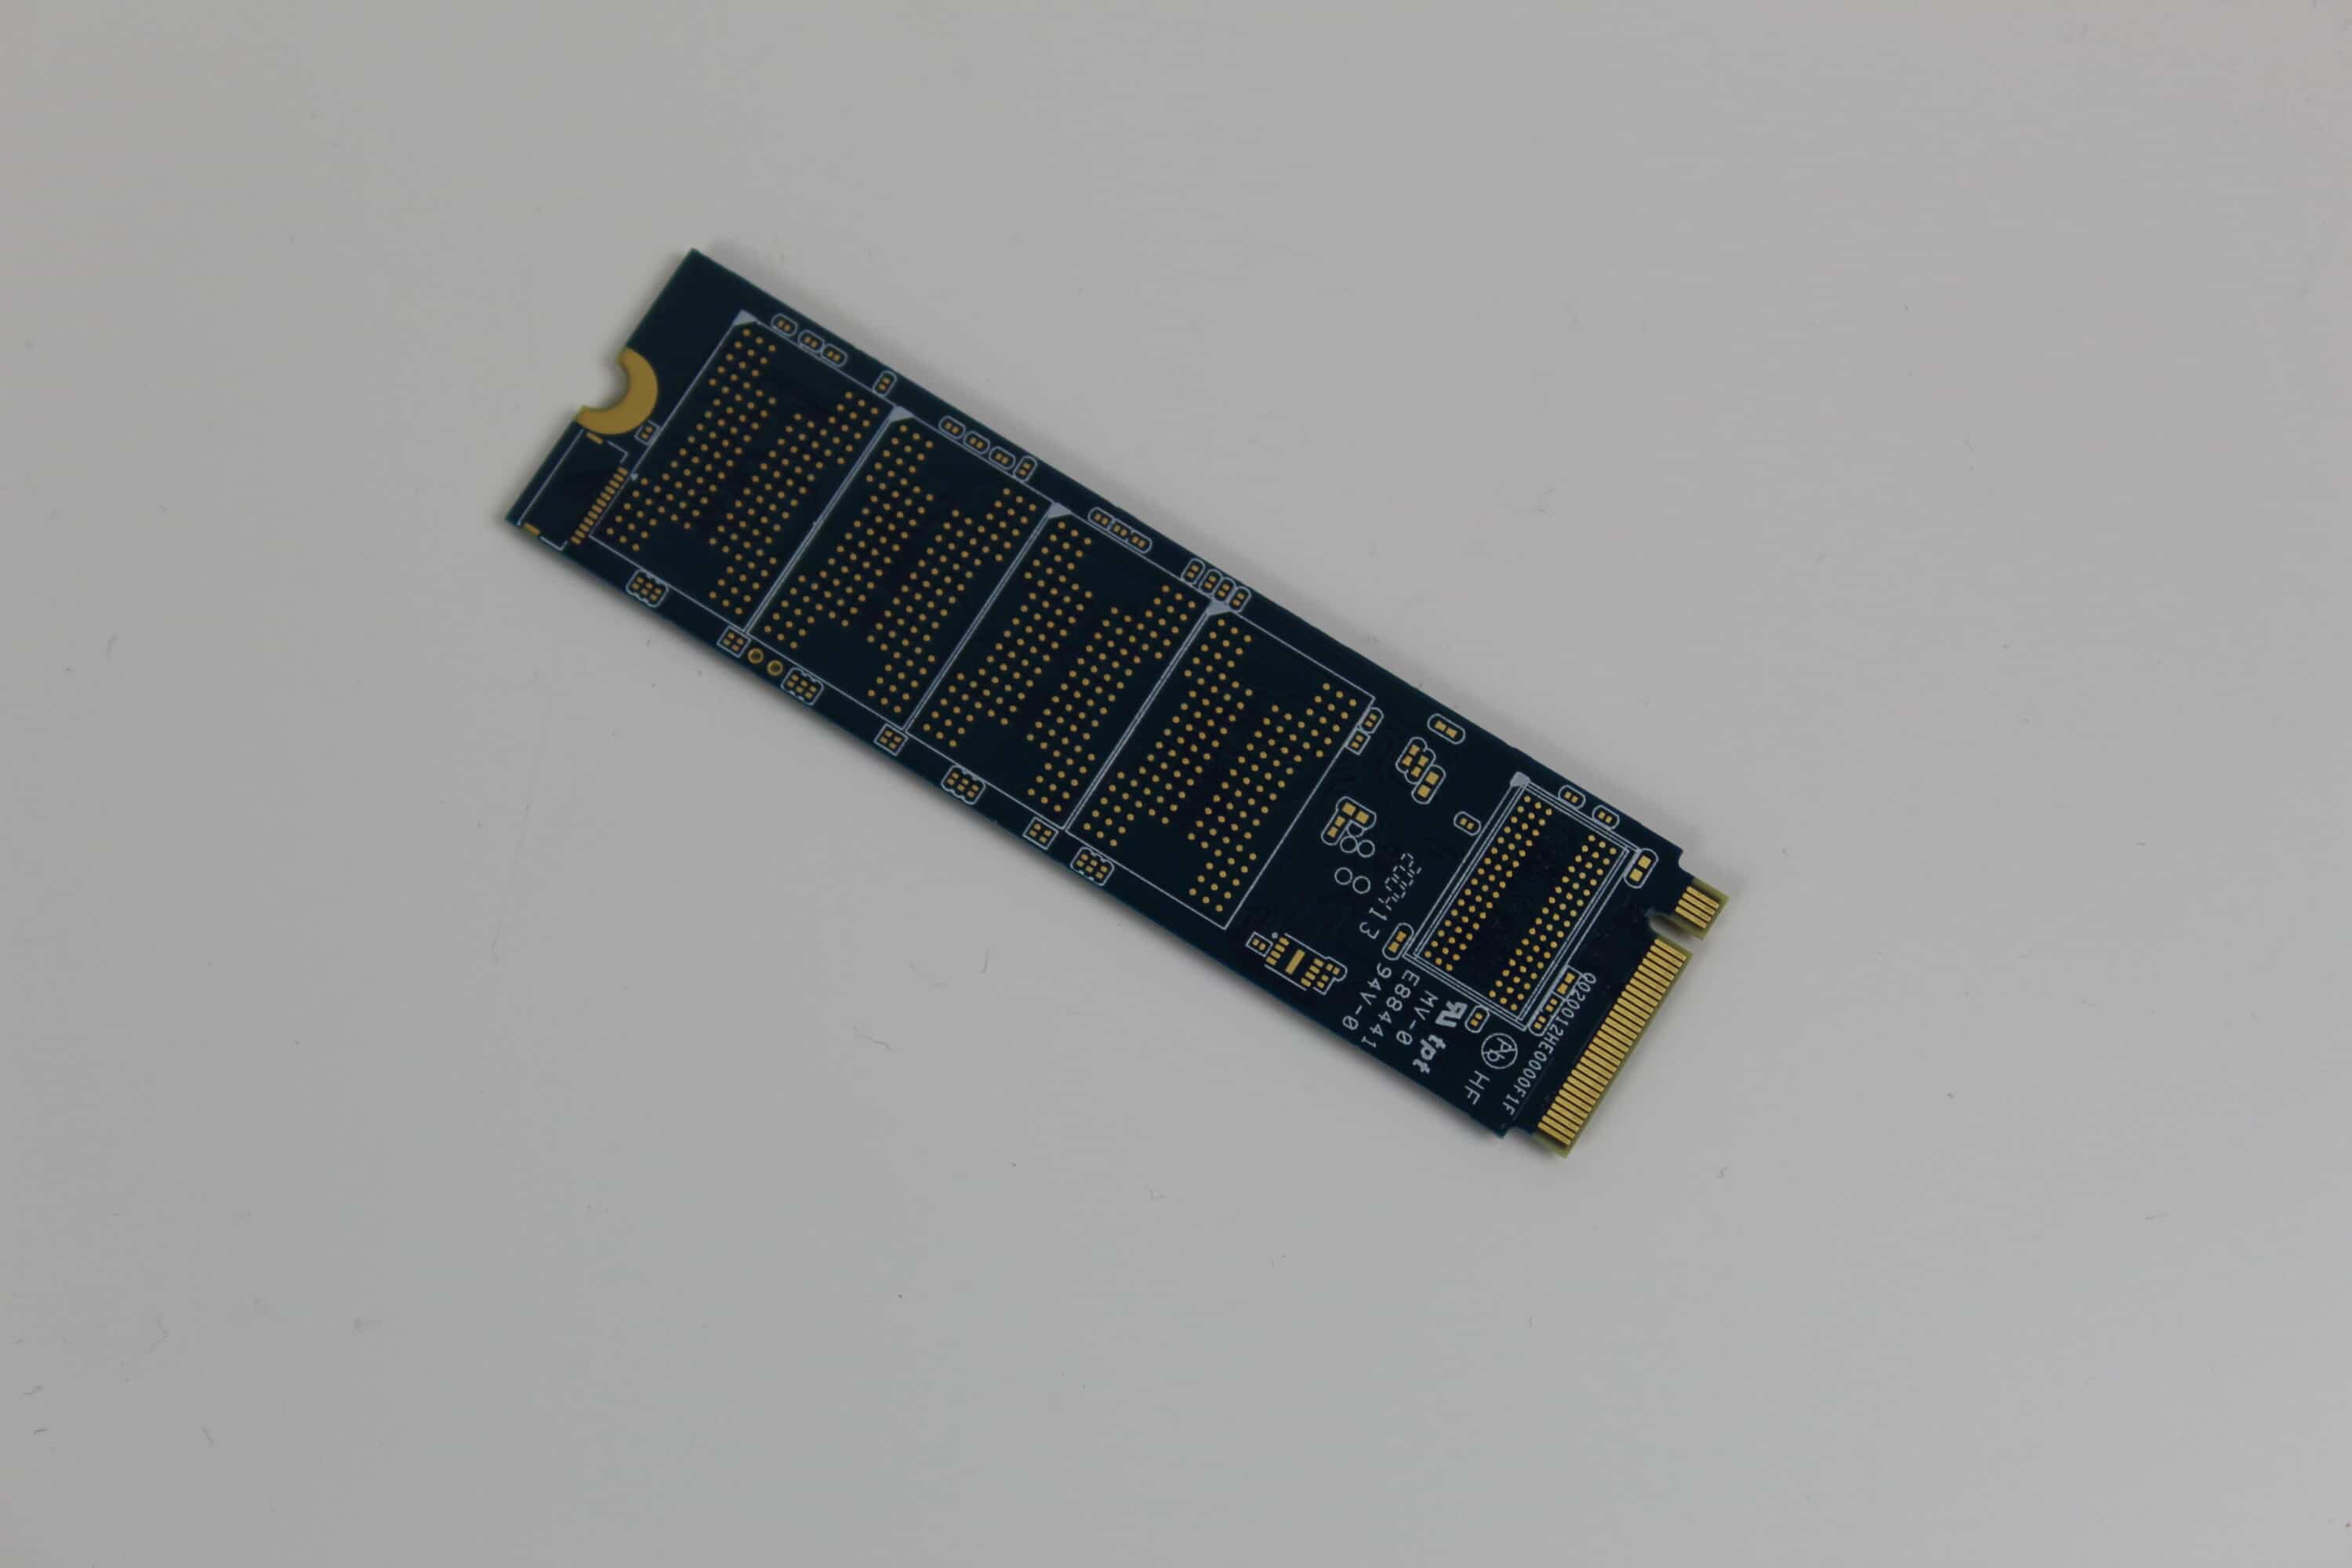
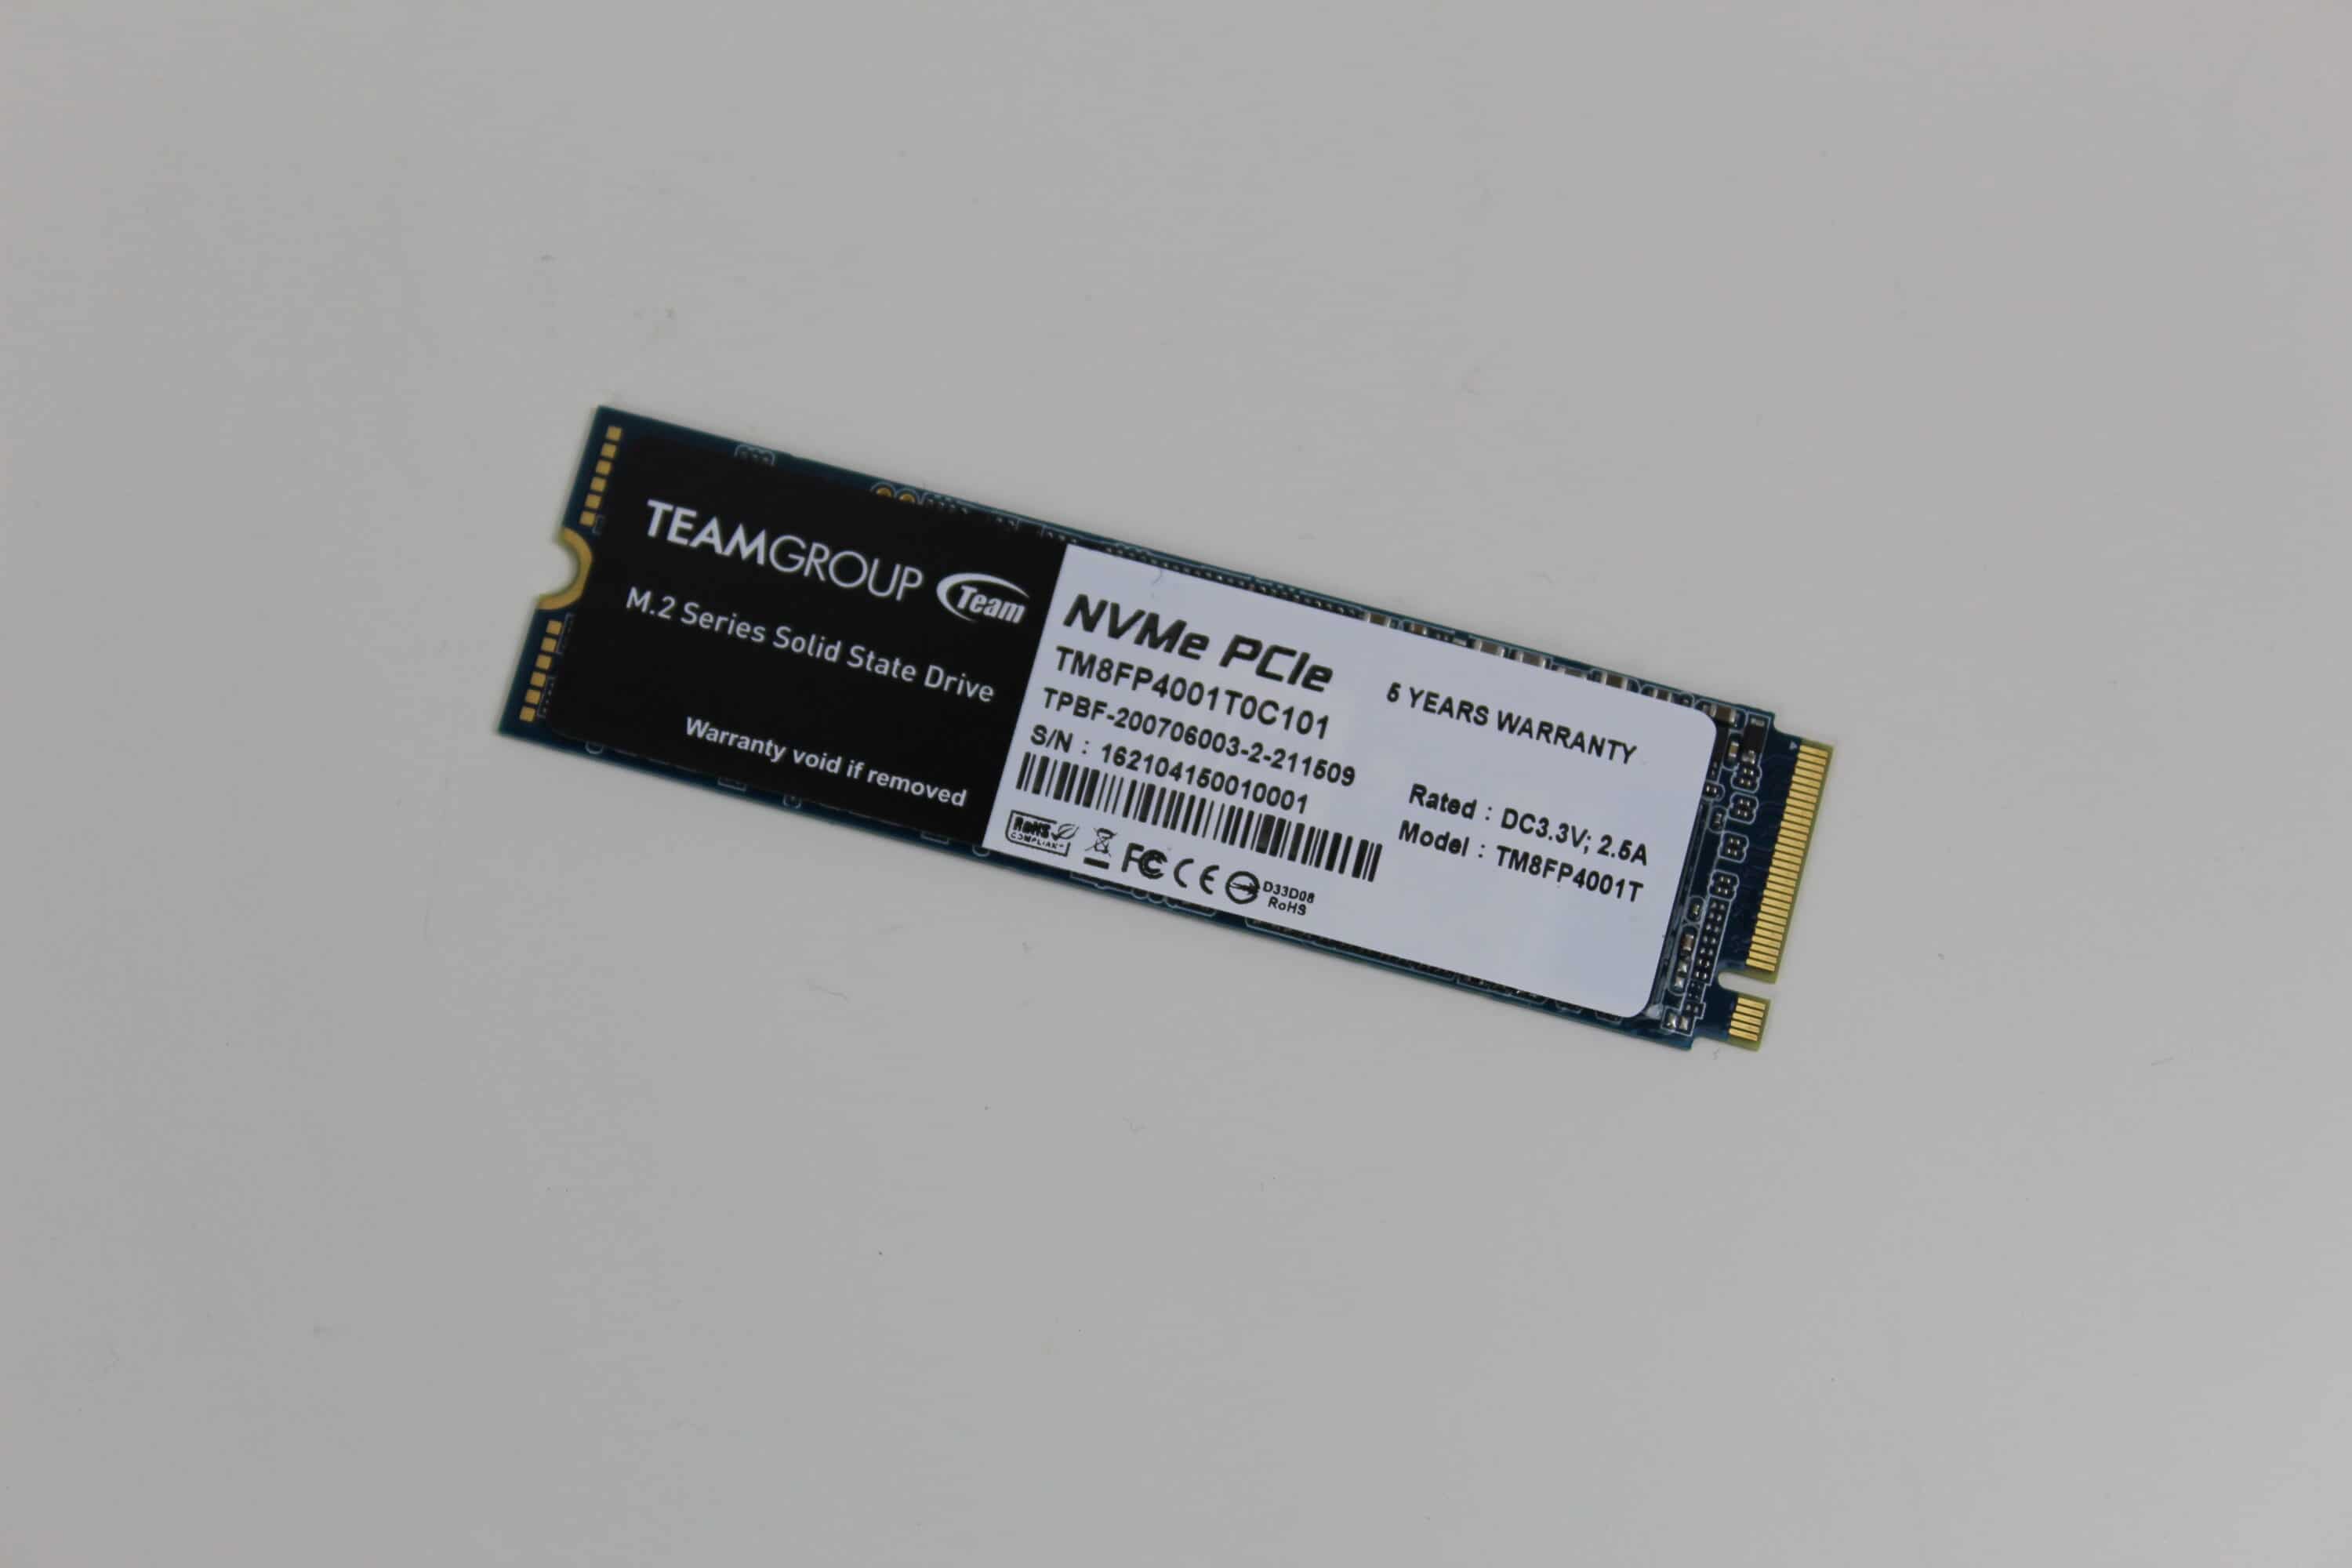
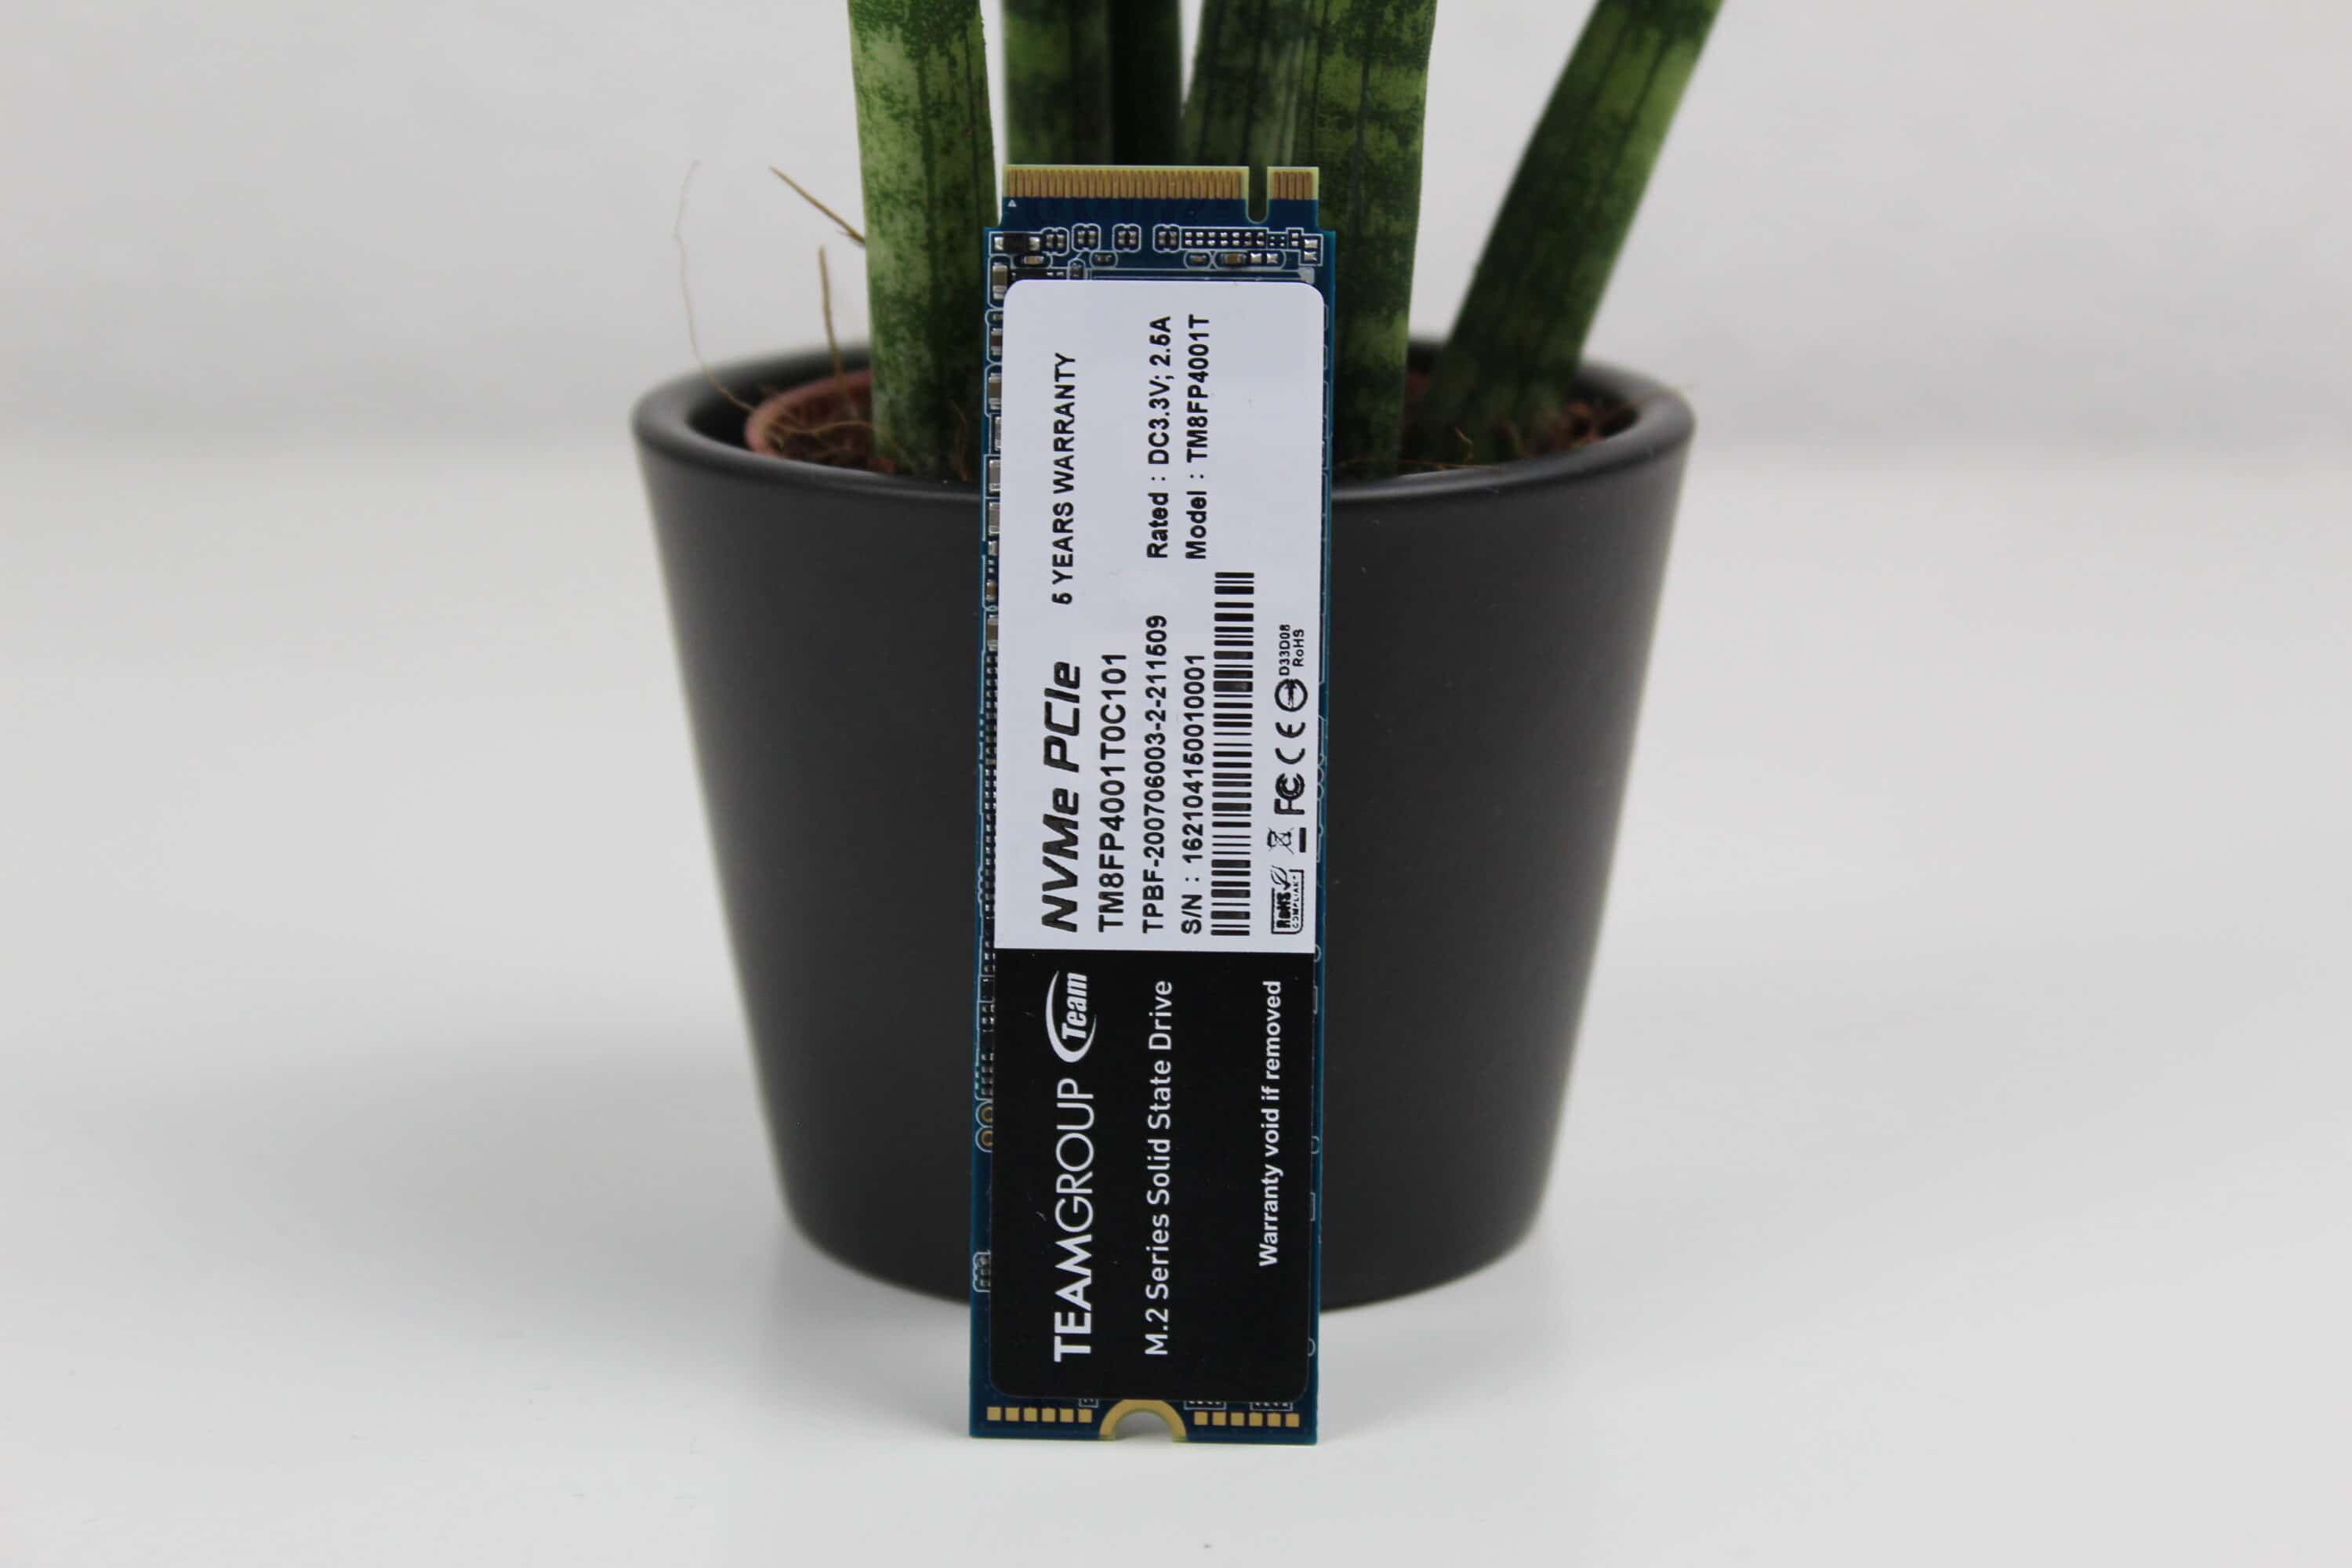
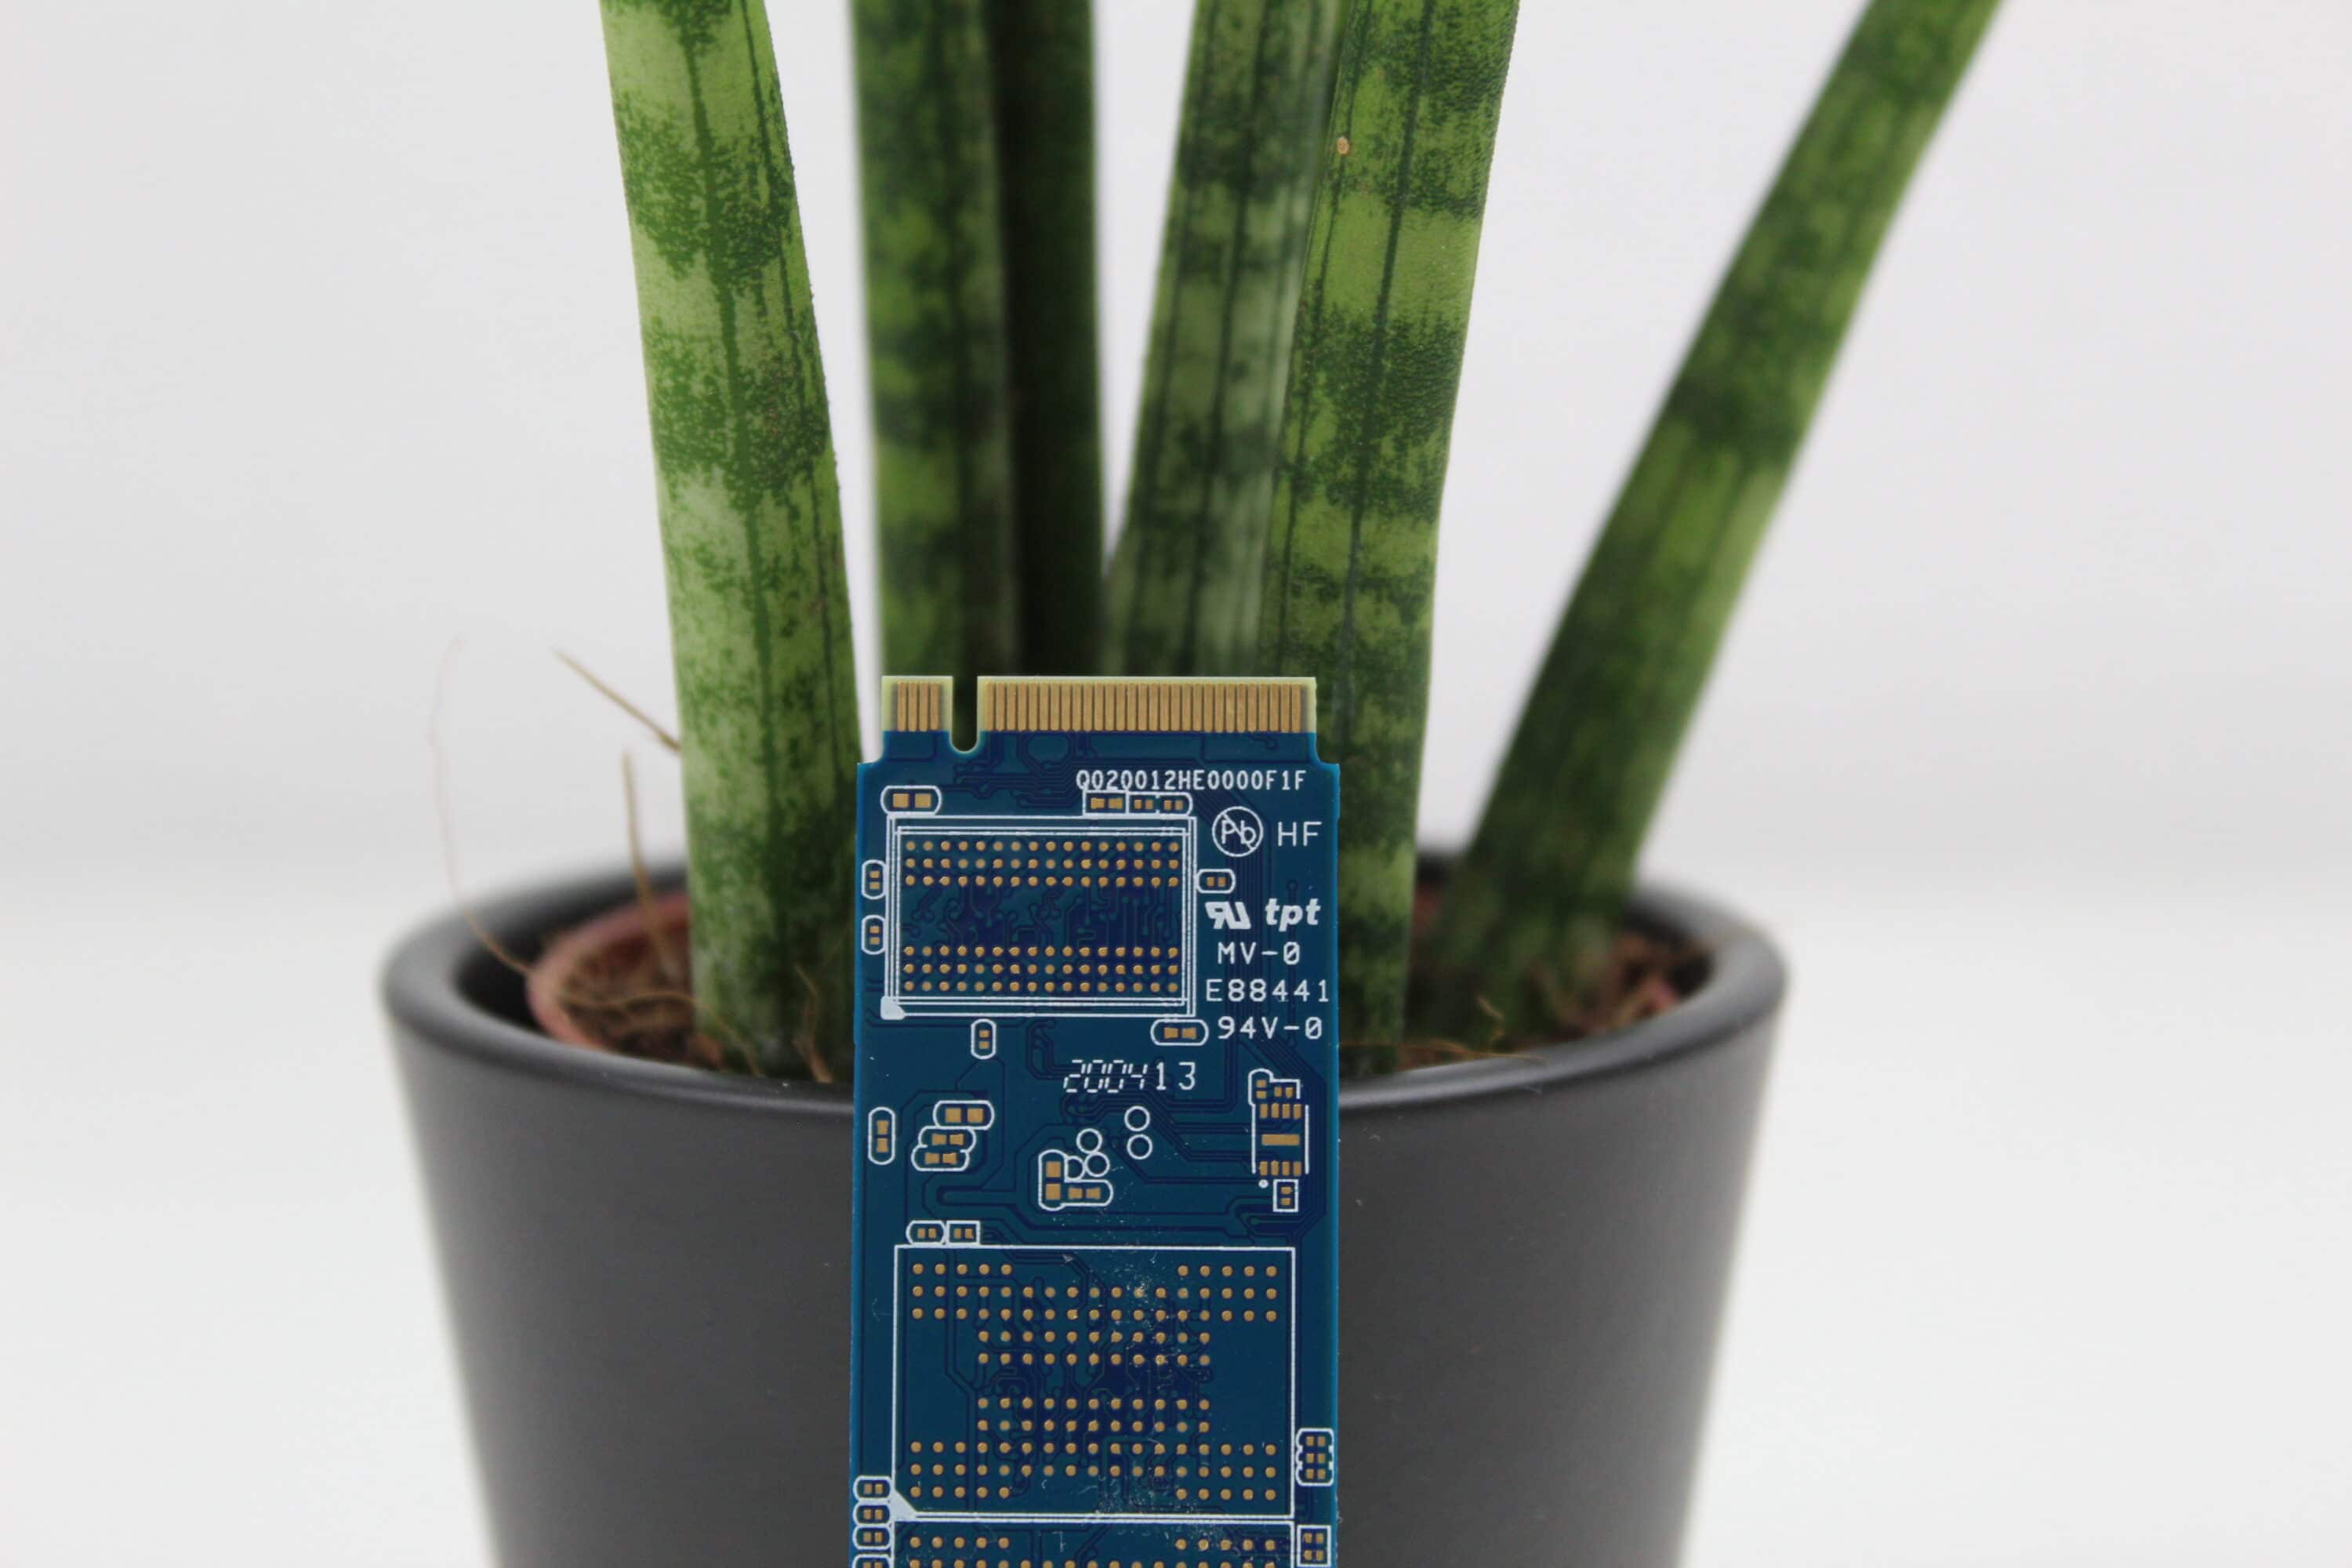
The chips that cover the SSD are covered by a sticker. This again includes the specifications and serial number – so all the important data is bundled. The back does not include any other RAM components.
Coolers etc. are omitted. Especially since more and more motherboards come with their own cooling block, we think this is a sensible way to save costs.
Test system
We installed the following components as our test system:
- Ryzen 5 3600
- MSI B550 Tomahawk
- Crucial Ballistix Sport LT 3000 MHz
- NVIDIA Geforce RTX 3080 Founders Edition
- Seasonic FOCUS GX-750 Vollmodulares PC-Netzteil 80PLUS Gold 750 Watt*
Performance
To compare the SSD’s performance to other SSDs we’ve already tested, we use a number of different benchmarks – specifically AS SSD, CrystalDiskMark, ATTO Disk, and HD Tune Pro.
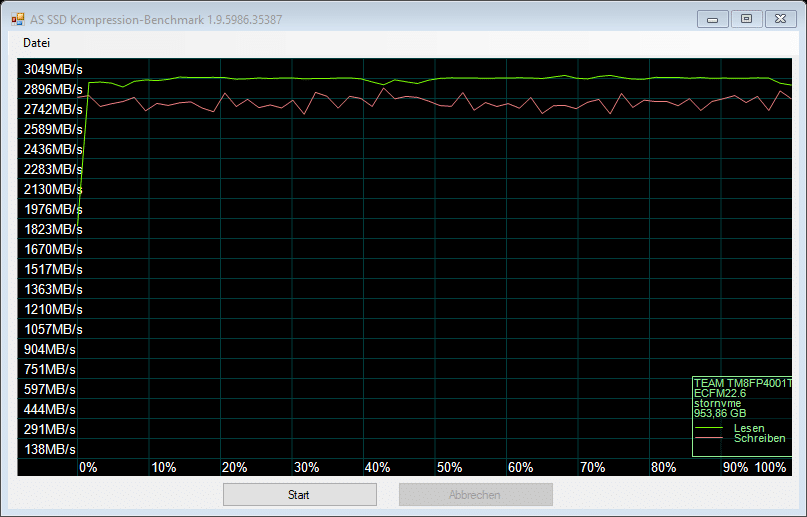
The AS SSD benchmark shows what the SSD is capable of. The MP34 competes with the best SSDs we have tested – both in read and write. Some of our current records can be broken here! The benchmark score also fits into the picture and speaks for itself. Although it is not at the performance top in the AS Copy benchmark, it still ranks well.
The CrystalDiskMark is particularly interesting – because Teamgroup uses it to advertise the read and write rates. Good to see: The SSD clearly exceeds the advertised values with a plus of 400 MB/s in read and 200 MB/s in write. Particularly in sequential writing, the performance can be improved.
In the ATTO Disk Mark, the read performance is in the good upper midfield, but the write performance is right at the top. That is still an understatement, because it currently wins the performance crown in write mode.
Very high average rates are measured in the HD Tune – only at the beginning is a small outlier downwards visible. However, this is only a single “negative peak” – and can be neglected in most scenarios. The access times are top; nothing stands in the SSD’s way here, either.
All in all, the SSD convinced us in terms of performance. The advertised values are met, and it plays right at the front in most areas. It can stay like this, Teamgroup!
| wdt_ID | SSD | Seq (lesen in MB/s) | Seq (schreiben in MB/s) | 4K (lesen in MB/s) | 4K (schreiben in MB/s) | 4K-64-Thrd (lesen in MB/s) | 4K-64-Thrd (schreiben in MB/s) |
|---|---|---|---|---|---|---|---|
| 1 | Samsung SSD 960 PRO 2 TB | 2.278,89 | 1.832,34 | 47,47 | 197,25 | 1.690,47 | 1.211,18 |
| 2 | Samsung SSD 960 EVO 1 TB | 2.833,98 | 1.977,16 | 38,95 | 207,29 | 1.301,00 | 992,33 |
| 3 | Plextor M8SeGN 256 GB | 2.170,45 | 637,79 | 35,37 | 5,44 | 282,25 | 8,73 |
| 4 | Plextor M9PeG 512 GB | 2.246,29 | 880,66 | 41,74 | 7,49 | 511,00 | 31,01 |
| 5 | Samsung SSD 970 EVO 2TB | 2.553,25 | 2.481,28 | 42,45 | 110,08 | 1.687,72 | 1.901,41 |
| 6 | Crucial P1 500 GB | 1.774,87 | 927,44 | 59,92 | 172,76 | 346,82 | 878,87 |
| 7 | Samsung SSD 970 Evo Plus 250 GB | 2.794,51 | 2.204,05 | 54,37 | 132,99 | 795,31 | 1.930,24 |
| 8 | WD Black SN750 1TB | 2.966,45 | 2.690,48 | 45,74 | 149,72 | 1.580,57 | 1.740,14 |
| 9 | WD Blue SN550 500 GB | 2.178,75 | 858,33 | 36,35 | 155,07 | 747,57 | 385,85 |
| 10 | Corsair MP510 480 GB | 2.409,10 | 1.264,05 | 48,06 | 148,67 | 684,76 | 1.258,88 |
| 11 | LC-Power Phenom Pro 1 TB | 2.926,34 | 2.560,03 | 56,02 | 144,17 | 1.199,26 | 1.390,36 |
| 12 | Pioneer APS-SE20Q 1 TB | 2.728,68 | 1.740,70 | 47,48 | 137,52 | 721,73 | 1.441,33 |
| 13 | XPG Spectrix S40G 1 TB | 2.833,85 | 1.496,62 | 46,72 | 110,77 | 1.240,11 | 836,95 |
| 14 | Team Group Cardea IOPS 1 TB | 2.860,91 | 2.733,69 | 54,90 | 133,84 | 1.998,03 | 1.812,39 |
| 15 | Samsung SSD 980 1 TB | 2.569,42 | 2.366,17 | 51,08 | 129,69 | 1.489,46 | 1.100,07 |
| 16 | Crucial P5 2 TB | 2.319,45 | 2.445,02 | 40,09 | 73,66 | 1.716,32 | 2.052,95 |
| 17 | goodram IRDM M.2 512 GB | 2.999,16 | 2.497,66 | 69,46 | 205,26 | 2.016,57 | 2.351,02 |
| 18 | TEAMGROUP MP34 1 TB | 2.968,56 | 2.806,79 | 69,46 | 191,71 | 1.767,79 | 2.597,34 |
| 19 | Silicon Power XD80 512 GB | 3.031,90 | 2.330,21 | 70,01 | 232,94 | 1.911,62 | 2.210,43 |
| 20 | Silicon Power US70 1TB | 4.285,45 | 3.856,62 | 78,81 | 246,76 | 2.928,71 | 3.674,07 |
| 21 | Kioxia Exceria 1 TB | 1.580,12 | 1.587,90 | 63,23 | 167,43 | 1.657,50 | 1.501,68 |
| 22 | Kioxia Exceria Plus 2 TB | 2.678,46 | 2.678,82 | 49,10 | 125,36 | 1.990,35 | 2.986,04 |
| 23 | Crucial P5 Plus 1 TB | 2.501,35 | 4.238,61 | 48,54 | 144,46 | 2.225,47 | 2.781,88 |
| 24 | WD_BLACK SN750 SE 1 TB | 3.157,27 | 2.566,19 | 52,84 | 181,71 | 2.233,36 | 2.254,34 |
| 25 | TeamGroup T-Force Cardea Ceramic C440 2 TB | 3.783,76 | 3.690,50 | 56,20 | 176,79 | 2.317,14 | 2.878,50 |
| 26 | WD Blue SN570 500 GB | 3.050,84 | 2.342,03 | 37,52 | 154,14 | 982,68 | 1.573,10 |
| 27 | Corsair Force Series MP600 Pro LPX 1 TB | 5.211,37 | 5.207,10 | 76,92 | 186,65 | 2.947,55 | 3.281,34 |
| 28 | goodram PX500 512GB | 2.264,99 | 1.561,40 | 49,21 | 184,05 | 881,04 | 831,01 |
| 29 | Kingston KC3000 1 TB | 5.425,19 | 5.172,04 | 90,74 | 190,77 | 2.935,80 | 3.132,12 |
| 30 | TeamGroup T-Force Cardea Z44L 1 TB | 2.639,24 | 2.432,48 | 81,06 | 272,34 | 2.275,26 | 993,65 |
| 31 | Adata Legend 840 1 TB | 3.701,46 | 3.976,39 | 75,74 | 235,64 | 1.602,58 | 2.219,75 |
| 32 | Silicon Power XPOWER XS70 1 TB | 5.138,97 | 5.055,37 | 99,34 | 264,38 | 2.971,08 | 2.825,82 |
| 33 | Kioxia Exceria Pro 2 TB | 5.307,65 | 5.216,05 | 84,56 | 234,07 | 2.368,25 | 3.061,54 |
| 34 | Corsair Force Series MP600 GS 2 TB | 3.834,92 | 3.476,47 | 93,92 | 253,17 | 2.227,09 | 1.384,78 |
| 35 | Crucial P3 2 TB | 3.126,73 | 2.937,83 | 78,29 | 232,44 | 2.237,47 | 2.320,77 |
| 36 | Crucial P3 Plus 2 TB | 3.837,97 | 3.874,93 | 81,09 | 243,28 | 2.309,87 | 2.884,90 |
| 37 | Kingston NV2 2 TB | 2.991,12 | 2.504,85 | 45,27 | 220,40 | 1.483,32 | 1.561,91 |
| 38 | ADATA XPG GAMMIX S70 BLADE | 5.468,15 | 5.103,35 | 53,62 | 123,57 | 1.593,89 | 1.920,43 |
| 39 | TeamGroup MP44 1 TB | 6.292,26 | 5.614,48 | 72,27 | 230,44 | 2.634,75 | 3.085,63 |
| 40 | Crucial T700 2 TB | 9.058,04 | 9.939,20 | 83,44 | 254,77 | 3.536,75 | 3.120,13 |
| 41 | Crucial T500 2 TB | 6.197,23 | 6.056,93 | 81,97 | 248,92 | 3.134,16 | 4.087,88 |
| 42 | Nextorage G Series 4 TB | 5.457,12 | 5.773,07 | 80,36 | 198,99 | 3.048,62 | 4.106,43 |
| 43 | Kioxia Exceria Plus G3 2 TB | 4.380,42 | 3.301,38 | 55,90 | 271,46 | 1.397,09 | 3.151,40 |
| 44 | TeamGroup T-Create Classic 1 TB | 4.371,84 | 4.386,65 | 67,66 | 232,00 | 2.848,70 | 3.182,26 |
| 45 | TeamGroup T-Force Cardea A440 2 TB | 6.154,44 | 5.639,12 | 93,37 | 264,84 | 3.245,40 | 4.229,33 |
| 46 | Crucial T705 2 TB | 10.558,92 | 10.663,69 | 81,34 | 251,15 | 3.384,47 | 4.454,84 |
| SSD | Seq (lesen in MB/s) | Seq (schreiben in MB/s) | 4K (lesen in MB/s) | 4K (schreiben in MB/s) | 4K-64-Thrd (lesen in MB/s) | 4K-64-Thrd (schreiben in MB/s) |
| wdt_ID | SSD | Lesen | Schreiben | Gesamt |
|---|---|---|---|---|
| 1 | Samsung SSD 960 PRO 2 TB | 1.966 | 1.592 | 4.542 |
| 2 | Samsung SSD 960 EVO 1 TB | 1.623 | 1.397 | 3.809 |
| 3 | Plextor M8SeGN 256 GB | 578 | 82 | 891 |
| 4 | Plextor M9PeG 512 GB | 777 | 127 | 1.244 |
| 5 | Samsung SSD 970 EVO 2TB | 1.985 | 2.228 | 5.219 |
| 6 | Crucial P1 500 GB | 584 | 1.144 | 2.008 |
| 7 | Samsung SSD 970 Evo Plus 250 GB | 1.129 | 2.284 | 3.975 |
| 8 | WD Black SN750 1TB | 1.923 | 2.159 | 5.052 |
| 9 | WD Blue SN550 500 GB | 1.002 | 627 | 2.082 |
| 10 | Corsair MP510 480 GB | 974 | 1.534 | 2.961 |
| 11 | LC-Power Phenom Pro 1 TB | 1.548 | 1.791 | 4.122 |
| 12 | Pioneer APS-SE20Q 1 TB | 1.042 | 1.753 | 3.290 |
| 13 | XPG Spectrix S40G 1 TB | 1.570 | 1.097 | 3.409 |
| 14 | Team Group Cardea IOPS 1 TB | 2.338 | 2.216 | 5.744 |
| 15 | Samsung SSD 980 1 TB | 1.197 | 1.466 | 4.178 |
| 16 | Crucial P5 2 TB | 1.988 | 2.371 | 5.380 |
| 17 | goodram IRDM M.2 512 GB | 2.386 | 2.732 | 6.310 |
| 18 | TEAMGROUP MP34 1 TB | 2.134 | 3.070 | 6.298 |
| 19 | Silicon Power XD80 512 GB | 2.285 | 2.676 | 6.103 |
| 20 | Silicon Power US70 1TB | 3.436 | 4.306 | 9.479 |
| 21 | Kioxia Exceria 1 TB | 1.879 | 1.828 | 4.678 |
| 22 | Kioxia Exceria Plus 2 TB | 2.307 | 3.379 | 6.865 |
| 23 | Crucial P5 Plus 1 TB | 2.524 | 3.350 | 7.248 |
| 24 | WD_BLACK SN750 SE 1 TB | 2.602 | 2.693 | 6.592 |
| 25 | TeamGroup T-Force Cardea Ceramic C440 2 TB | 2.748 | 3.424 | 7.571 |
| 26 | WD Blue SN570 500 GB | 1.325 | 1.961 | 3.933 |
| 27 | Corsair Force Series MP600 Pro LPX 1 TB | 3.546 | 3.989 | 9.345 |
| 28 | goodram PX500 512GB | 1.157 | 1.171 | 2.896 |
| 29 | Kingston KC3000 1 TB | 3.525 | 3.913 | 9.227 |
| 30 | TeamGroup T-Force Cardea Z44L 1 TB | 2.620 | 1.509 | 5.470 |
| 31 | Adata Legend 840 1 TB | 2.048 | 2.853 | 5.977 |
| 32 | Silicon Power XPOWER XS70 1 TB | 3.584 | 3.596 | 9.018 |
| 33 | Kioxia Exceria Pro 2 TB | 2.984 | 3.817 | 8.330 |
| 34 | Corsair Force Series MP600 GS 2 TB | 2.704 | 1.986 | 6.071 |
| 35 | Crucial P3 2 TB | 2.628 | 2.847 | 6.819 |
| 36 | Crucial P3 Plus 2 TB | 2.775 | 3.516 | 7.720 |
| 37 | Kingston NV2 2 TB | 1.828 | 2.033 | 4.773 |
| 38 | ADATA XPG GAMMIX S70 BLADE | 2.194 | 2.554 | 5.854 |
| 39 | TeamGroup MP44 1 TB | 3.336 | 3.878 | 8.884 |
| 40 | Crucial T700 2 TB | 4.526 | 4.369 | 11.244 |
| 41 | Crucial T500 2 TB | 3.836 | 4.942 | 10.730 |
| 42 | Nextorage G Series 4 TB | 3.949 | 4.693 | 10.650 |
| 43 | Kioxia Exceria Plus G3 2 TB | 1.891 | 3.753 | 6.564 |
| 44 | TeamGroup T-Create Classic 1 TB | 3.381 | 3.853 | 8.972 |
| 45 | TeamGroup T-Force Cardea A440 2 TB | 3.954 | 5.058 | 11.010 |
| 46 | Crucial T705 2 TB | 4.522 | 5.772 | 12.601 |
| SSD | Lesen | Schreiben | Gesamt |
AS SSD Compression Benchmark
| wdt_ID | SSD | ISO (in MB/s) | Programm (in MB/s) | Spiel (in MB/s) |
|---|---|---|---|---|
| 1 | Samsung SSD 960 PRO 2 TB | 1.827,04 | 647,49 | 483,93 |
| 2 | Samsung SSD 960 EVO 1 TB | 1.917,71 | 283,09 | 471,35 |
| 3 | Plextor M8SeGN 256 GB | 1.471,74 | 547,76 | 1.166,32 |
| 4 | Plextor M9PeG 512 GB | 1.566,28 | 632,28 | 1.130,44 |
| 5 | Samsung SSD 970 EVO 2TB | 1.378,01 | 354,96 | 749,40 |
| 6 | Crucial P1 500 GB | 977,33 | 363,49 | 558,79 |
| 7 | Samsung SSD 970 Evo Plus 250 GB | 1.405,19 | 414,16 | 921,26 |
| 8 | WD Black SN750 1TB | 1.682,28 | 426,18 | 943,93 |
| 10 | WD Blue SN550 500 GB | 1.108,05 | 349,78 | 419,12 |
| 11 | Corsair MP510 480 GB | 1.040,48 | 190,51 | 762,33 |
| 12 | LC-Power Phenom Pro 1 TB | 1.196,60 | 153,90 | 868,05 |
| 13 | Pioneer APS-SE20Q 1 TB | 961,05 | 322,21 | 748,55 |
| 14 | XPG Spectrix S40G 1 TB | 2.076,52 | 591,51 | 1.327,85 |
| 15 | Team Group Cardea IOPS 1 TB | 1.901,03 | 650,28 | 1.313,24 |
| 16 | Samsung SSD 980 1 TB | 1.294,84 | 338,29 | 944,94 |
| 17 | Crucial P5 2 TB | 1.923,18 | 1.010,93 | 1.629,58 |
| 18 | goodram IRDM M.2 512 GB | 2.194,08 | 948,05 | 1.298,95 |
| 19 | TEAMGROUP MP34 1 TB | 1.984,76 | 854,77 | 1.489,55 |
| 20 | Silicon Power XD80 512 GB | 2.359,27 | 1.065,63 | 1.876,26 |
| 21 | Silicon Power US70 1TB | 3.011,38 | 1.224,04 | 2.328,32 |
| 22 | Kioxia Exceria 1 TB | 1.296,82 | 408,44 | 596,72 |
| 23 | Kioxia Exceria Plus 2 TB | 2.076,71 | 1.060,45 | 1.763,90 |
| 24 | Crucial P5 Plus 1 TB | 2.917,07 | 410,88 | 1.225,89 |
| 25 | WD_BLACK SN750 SE 1 TB | 2.103,68 | 379,38 | 1.046,72 |
| 26 | TeamGroup T-Force Cardea Ceramic C440 2 TB | 2.735,59 | 401,44 | 1.156,82 |
| 27 | WD Blue SN570 500 GB | 2.295,18 | 411,62 | 1.099,37 |
| 28 | Corsair Force Series MP600 Pro LPX 1 TB | 3.076,12 | 413,18 | 1.232,93 |
| 29 | goodram PX500 512GB | 1.801,72 | 304,17 | 568,27 |
| 30 | Kingston KC3000 1 TB | 2.973,39 | 409,04 | 1.213,11 |
| 31 | TeamGroup T-Force Cardea Z44L 1 TB | 1.948,30 | 374,06 | 988,76 |
| 32 | Adata Legend 840 1 TB | 2.543,82 | 388,18 | 1.135,27 |
| 33 | Silicon Power XPOWER XS70 1 TB | 2.805,98 | 447,39 | 1.154,33 |
| 34 | Kioxia Exceria Pro 2 TB | 2.594,74 | 409,41 | 1.043,58 |
| 35 | Corsair Force Series MP600 GS 2 TB | 2.323,46 | 1.002,08 | 1.612,10 |
| 36 | Crucial P3 2 TB | 2.182,93 | 383,13 | 1.056,01 |
| 37 | Crucial P3 Plus 2 TB | 2.751,88 | 395,22 | 1.164,56 |
| 38 | Kingston NV2 2 TB | 2.112,46 | 1.191,60 | 2.398,90 |
| 39 | ADATA XPG GAMMIX S70 BLADE | 3.092,41 | 639,48 | 1.691,61 |
| 40 | TeamGroup MP44 1 TB | 1.134,91 | 745,34 | 1.069,53 |
| 41 | Crucial T700 2 TB | 4.661,57 | 1.556,02 | 3.005,81 |
| 42 | Crucial T500 2 TB | 4.188,85 | 1.691,40 | 3.166,24 |
| 43 | Nextorage G Series 4 TB | 4.557,63 | 1.058,92 | 2.804,48 |
| 44 | Kioxia Exceria Plus G3 2 TB | 2.856,23 | 1.470,23 | 2.704,32 |
| 45 | TeamGroup T-Create Classic 1 TB | 4.421,38 | 735,61 | 2.075,70 |
| 46 | TeamGroup T-Force Cardea A440 2 TB | 3.733,06 | 1.547,39 | 3.326,25 |
| 47 | Crucial T705 2 TB | 4.927,01 | 1.670,66 | 3.478,30 |
| SSD | ISO (in MB/s) | Programm (in MB/s) | Spiel (in MB/s) |
| wdt_ID | SSD | AS SSD (lesen) | AS SSD (schreiben) | HD Tune Pro |
|---|---|---|---|---|
| 1 | Samsung SSD 960 PRO 2 TB | 0,220 | 0,373 | 0,018 |
| 2 | Samsung SSD 960 EVO 1 TB | 0,000 | 0,402 | 0,023 |
| 3 | Plextor M8SeGN 256 GB | 0,024 | 0,832 | 0,021 |
| 4 | Plextor M9PeG 512 GB | 0,020 | 0,592 | 0,018 |
| 5 | Samsung SSD 970 EVO 2TB | 0,032 | 0,349 | 0,018 |
| 6 | Crucial P1 500 GB | 0,020 | 0,448 | 0,017 |
| 7 | Samsung SSD 970 Evo Plus 250 GB | 0,049 | 0,027 | 0,049 |
| 8 | WD Black SN750 1TB | 0,030 | 0,024 | 0,034 |
| 9 | WD Blue SN550 500 GB | 0,028 | 0,585 | 0,021 |
| 10 | Corsair MP510 480 GB | 0,051 | 0,250 | 0,034 |
| 11 | LC-Power Phenom Pro 1 TB | 0,265 | 0,023 | |
| 12 | Pioneer APS-SE20Q 1 TB | 0,032 | 0,271 | 0,033 |
| 13 | XPG Spectrix S40G 1 TB | 0,038 | 0,062 | |
| 14 | Team Group Cardea IOPS 1 TB | 0,028 | 0,036 | |
| 15 | Samsung SSD 980 1 TB | 0,299 | 0,028 | |
| 16 | Crucial P5 2 TB | 0,106 | 0,050 | |
| 17 | goodram IRDM M.2 512 GB | 0,024 | 0,018 | 0,027 |
| 18 | TEAMGROUP MP34 1 TB | 0,024 | 0,018 | 0,026 |
| 19 | Silicon Power XD80 512 GB | 0,024 | 0,016 | 0,024 |
| 20 | Silicon Power US70 1TB | 0,017 | 0,016 | 0,018 |
| 21 | Kioxia Exceria 1 TB | 0,025 | 0,022 | 0,025 |
| 22 | Kioxia Exceria Plus 2 TB | 0,022 | 0,028 | |
| 23 | Crucial P5 Plus 1 TB | 0,027 | 0,028 | 0,026 |
| 24 | WD_BLACK SN750 SE 1 TB | 0,019 | 0,105 | 0,015 |
| 25 | TeamGroup T-Force Cardea Ceramic C440 2 TB | 0,022 | 0,023 | |
| 26 | WD Blue SN570 500 GB | 0,027 | 0,024 | |
| 27 | Corsair Force Series MP600 Pro LPX 1 TB | 0,019 | 0,021 | 0,018 |
| 28 | goodram PX500 512GB | 0,021 | 0,101 | 0,019 |
| 29 | Kingston KC3000 1 TB | 0,020 | 0,018 | |
| 30 | TeamGroup T-Force Cardea Z44L 1 TB | 0,318 | 0,019 | |
| 31 | Adata Legend 840 1 TB | 0,020 | 0,047 | |
| 32 | Silicon Power XPOWER XS70 1 TB | 0,015 | 0,018 | |
| 33 | Kioxia Exceria Pro 2 TB | 0,016 | 0,018 | |
| 34 | Corsair Force Series MP600 GS 2 TB | 0,014 | 0,020 | 0,019 |
| 35 | Crucial P3 2 TB | 0,015 | 0,016 | 0,017 |
| 36 | Crucial P3 Plus 2 TB | 0,014 | 0,015 | 0,015 |
| 37 | Kingston NV2 2 TB | 0,132 | 0,023 | |
| 38 | ADATA XPG GAMMIX S70 BLADE | 0,026 | 0,031 | 0,038 |
| 39 | TeamGroup MP44 1 TB | 0,021 | 0,047 | 0,025 |
| 40 | Crucial T700 2 TB | 0,015 | 0,039 | 0,017 |
| 41 | Crucial T500 2 TB | 0,022 | 0,017 | 0,028 |
| 42 | Nextorage G Series 4 TB | 0,023 | 0,020 | 0,035 |
| 43 | Kioxia Exceria Plus G3 2 TB | 0,014 | 0,014 | 0,019 |
| 44 | TeamGroup T-Create Classic 1 TB | 0,016 | 0,016 | 0,019 |
| 46 | TeamGroup T-Force Cardea A440 2 TB | 0,016 | 0,015 | 0,020 |
| 47 | Crucial T705 2 TB | 0,017 | 0,036 | 0,021 |
| SSD | AS SSD (lesen) | AS SSD (schreiben) | HD Tune Pro |
Conclusion

The MP34 presents a good overall picture. A high data throughput that mostly meets the specifications, a high guaranteed write performance, five years warranty – and all that at a humane price (test time ~€115, current: € 92.83 *). The access times are also convincing.
The combination of price and lifespan make you think twice, even if you don’t need the performance yourself at the moment. For a few euros more compared to a conventional SATA SSD, you already get top performance – at a solid price. However, whether it is the new “force” in the market remains to be questioned.
In summary – well-rounded product, Gold Award!

TEAMGROUP MP34 1 TB
Access times
Transfer rate (read)
Transfer rate (write)
Value for money
93/100
Solid SSD at a reasonable price. The advertised data throughputs can be maintained. Super!