
After we last took a closer look at the TeamGroup MP44 in the M.2 2280 form factor, we now have the TeamGroup VULCAN Z from the T-FORCE series as a SATA SSD ready for today’s review. According to the manufacturer, this SSD is an inexpensive SSD solution that is mainly aimed at budget gamers. TeamGroup offers the VULCAN Z in different sizes from at least 240 GB up to 2 TB. Key features of the product include 3D NAND technology, as well as improved performance for seamless in-between gaming. To manage the high performance, the VULCAN Z SSD features an intelligent SLC caching algorithm. Support for the well-known S.M.A.R.T. technology for lifetime monitoring and Windows TRIM mode are also integrated.
The TeamGroup VULCAN Z SSD thus stands for speed without compromise. In the upcoming review, we will reveal all the details and show how TeamGroup’s SATA SSD with a capacity of 2 TB compares to other products from well-known manufacturers.
Technical data
| Model | T-FORCE VULCAN Z |
| Capacity | 2 TB |
| Interface | SATA Rev. 3.0 (6Gb/s) |
| Color | Black |
| DRAM Cache | Not available |
| Controller | Silicon Motion SM2258XT |
| Max. Read/write speed (MB/s) | 550/500 |
| Voltage |
DC +5V |
| Operating temperature | 0 °C – 70 °C |
| Vibration | 20 G (not in operation) |
| Dimensions (L x W x H) | 100 x 69.9 x 7 mm |
| Weight | 45 g |
| MTBF | 1 million hours |
| TBW | 1,600 TB |
| Warranty | 3 years |
| Price |
€ 132.16 * |


Scope of delivery
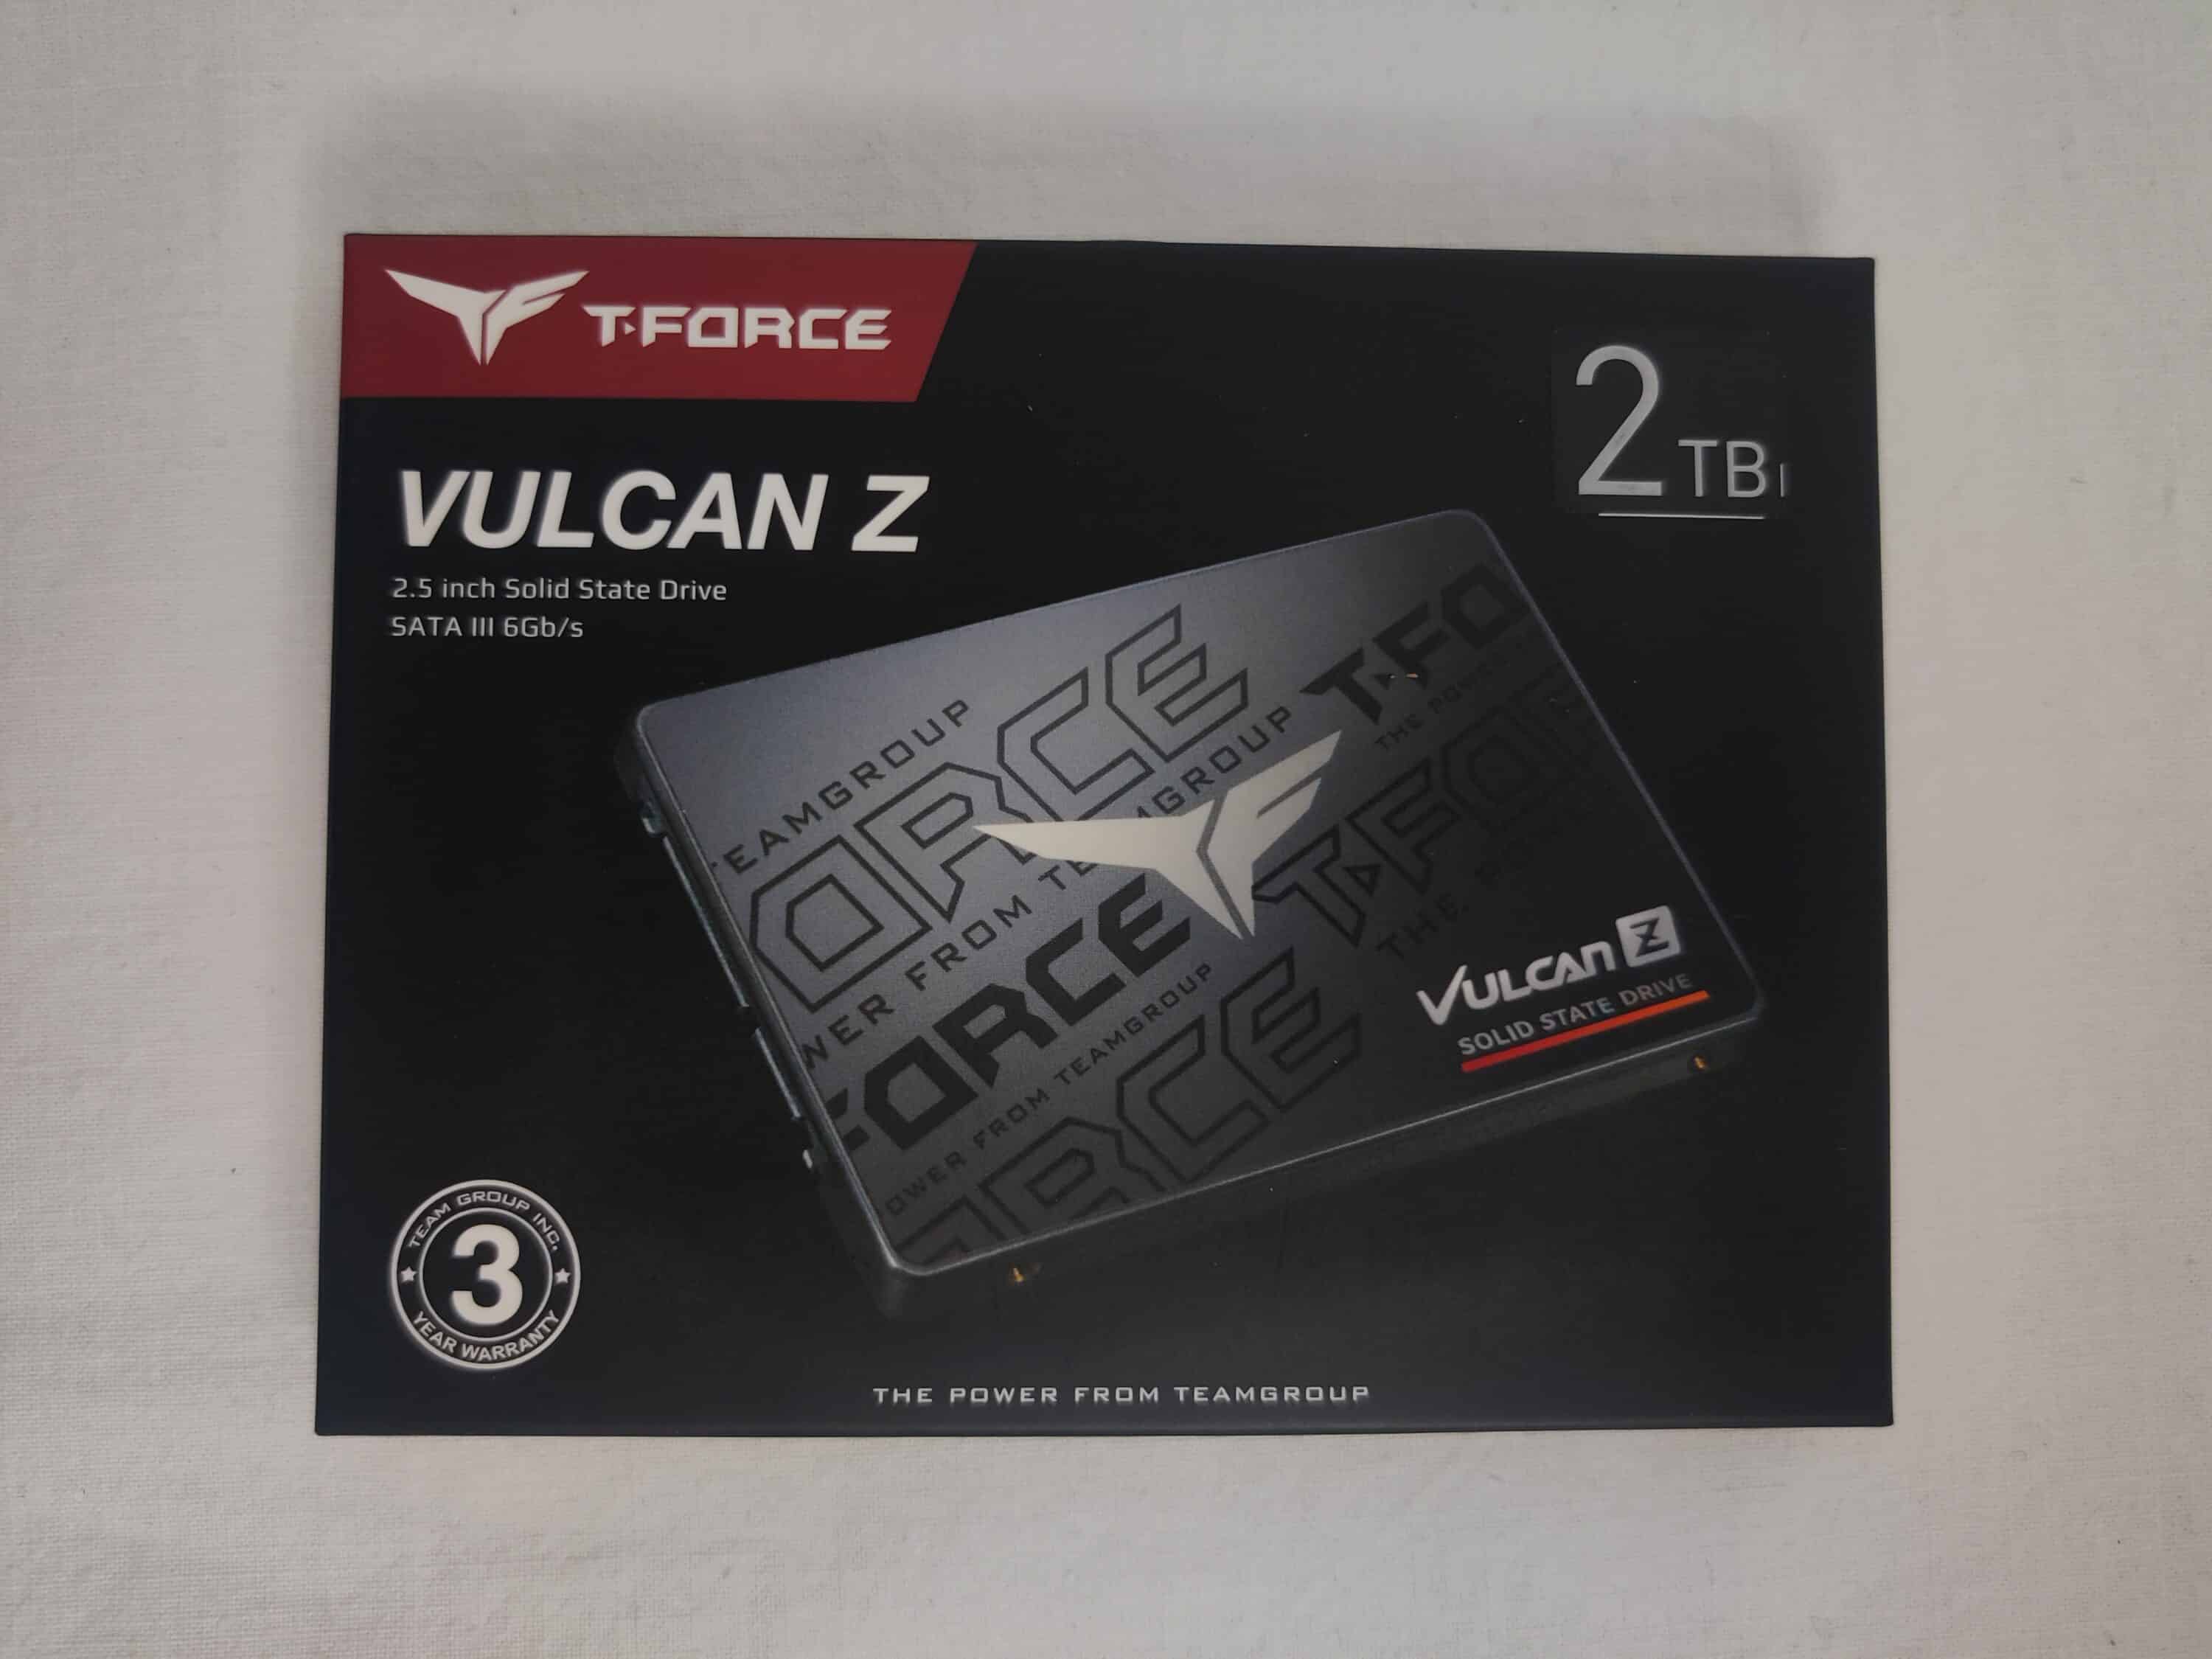
As usual for hard drives, the scope of delivery remains manageable and limited to the bare essentials. The black and red cardboard packaging contains the 2.5-inch TeamGroup VULCAN Z SSD. The front of the packaging discreetly showcases the SSD on a black background. Additionally, a 3-year warranty seal is shown on the left side. If we turn the packaging around, a short list of technical data is printed on the back. Furthermore, the TeamGroup VULCAN Z label is revealed due to a transparent cutout in the center.

An overview of the installed technology
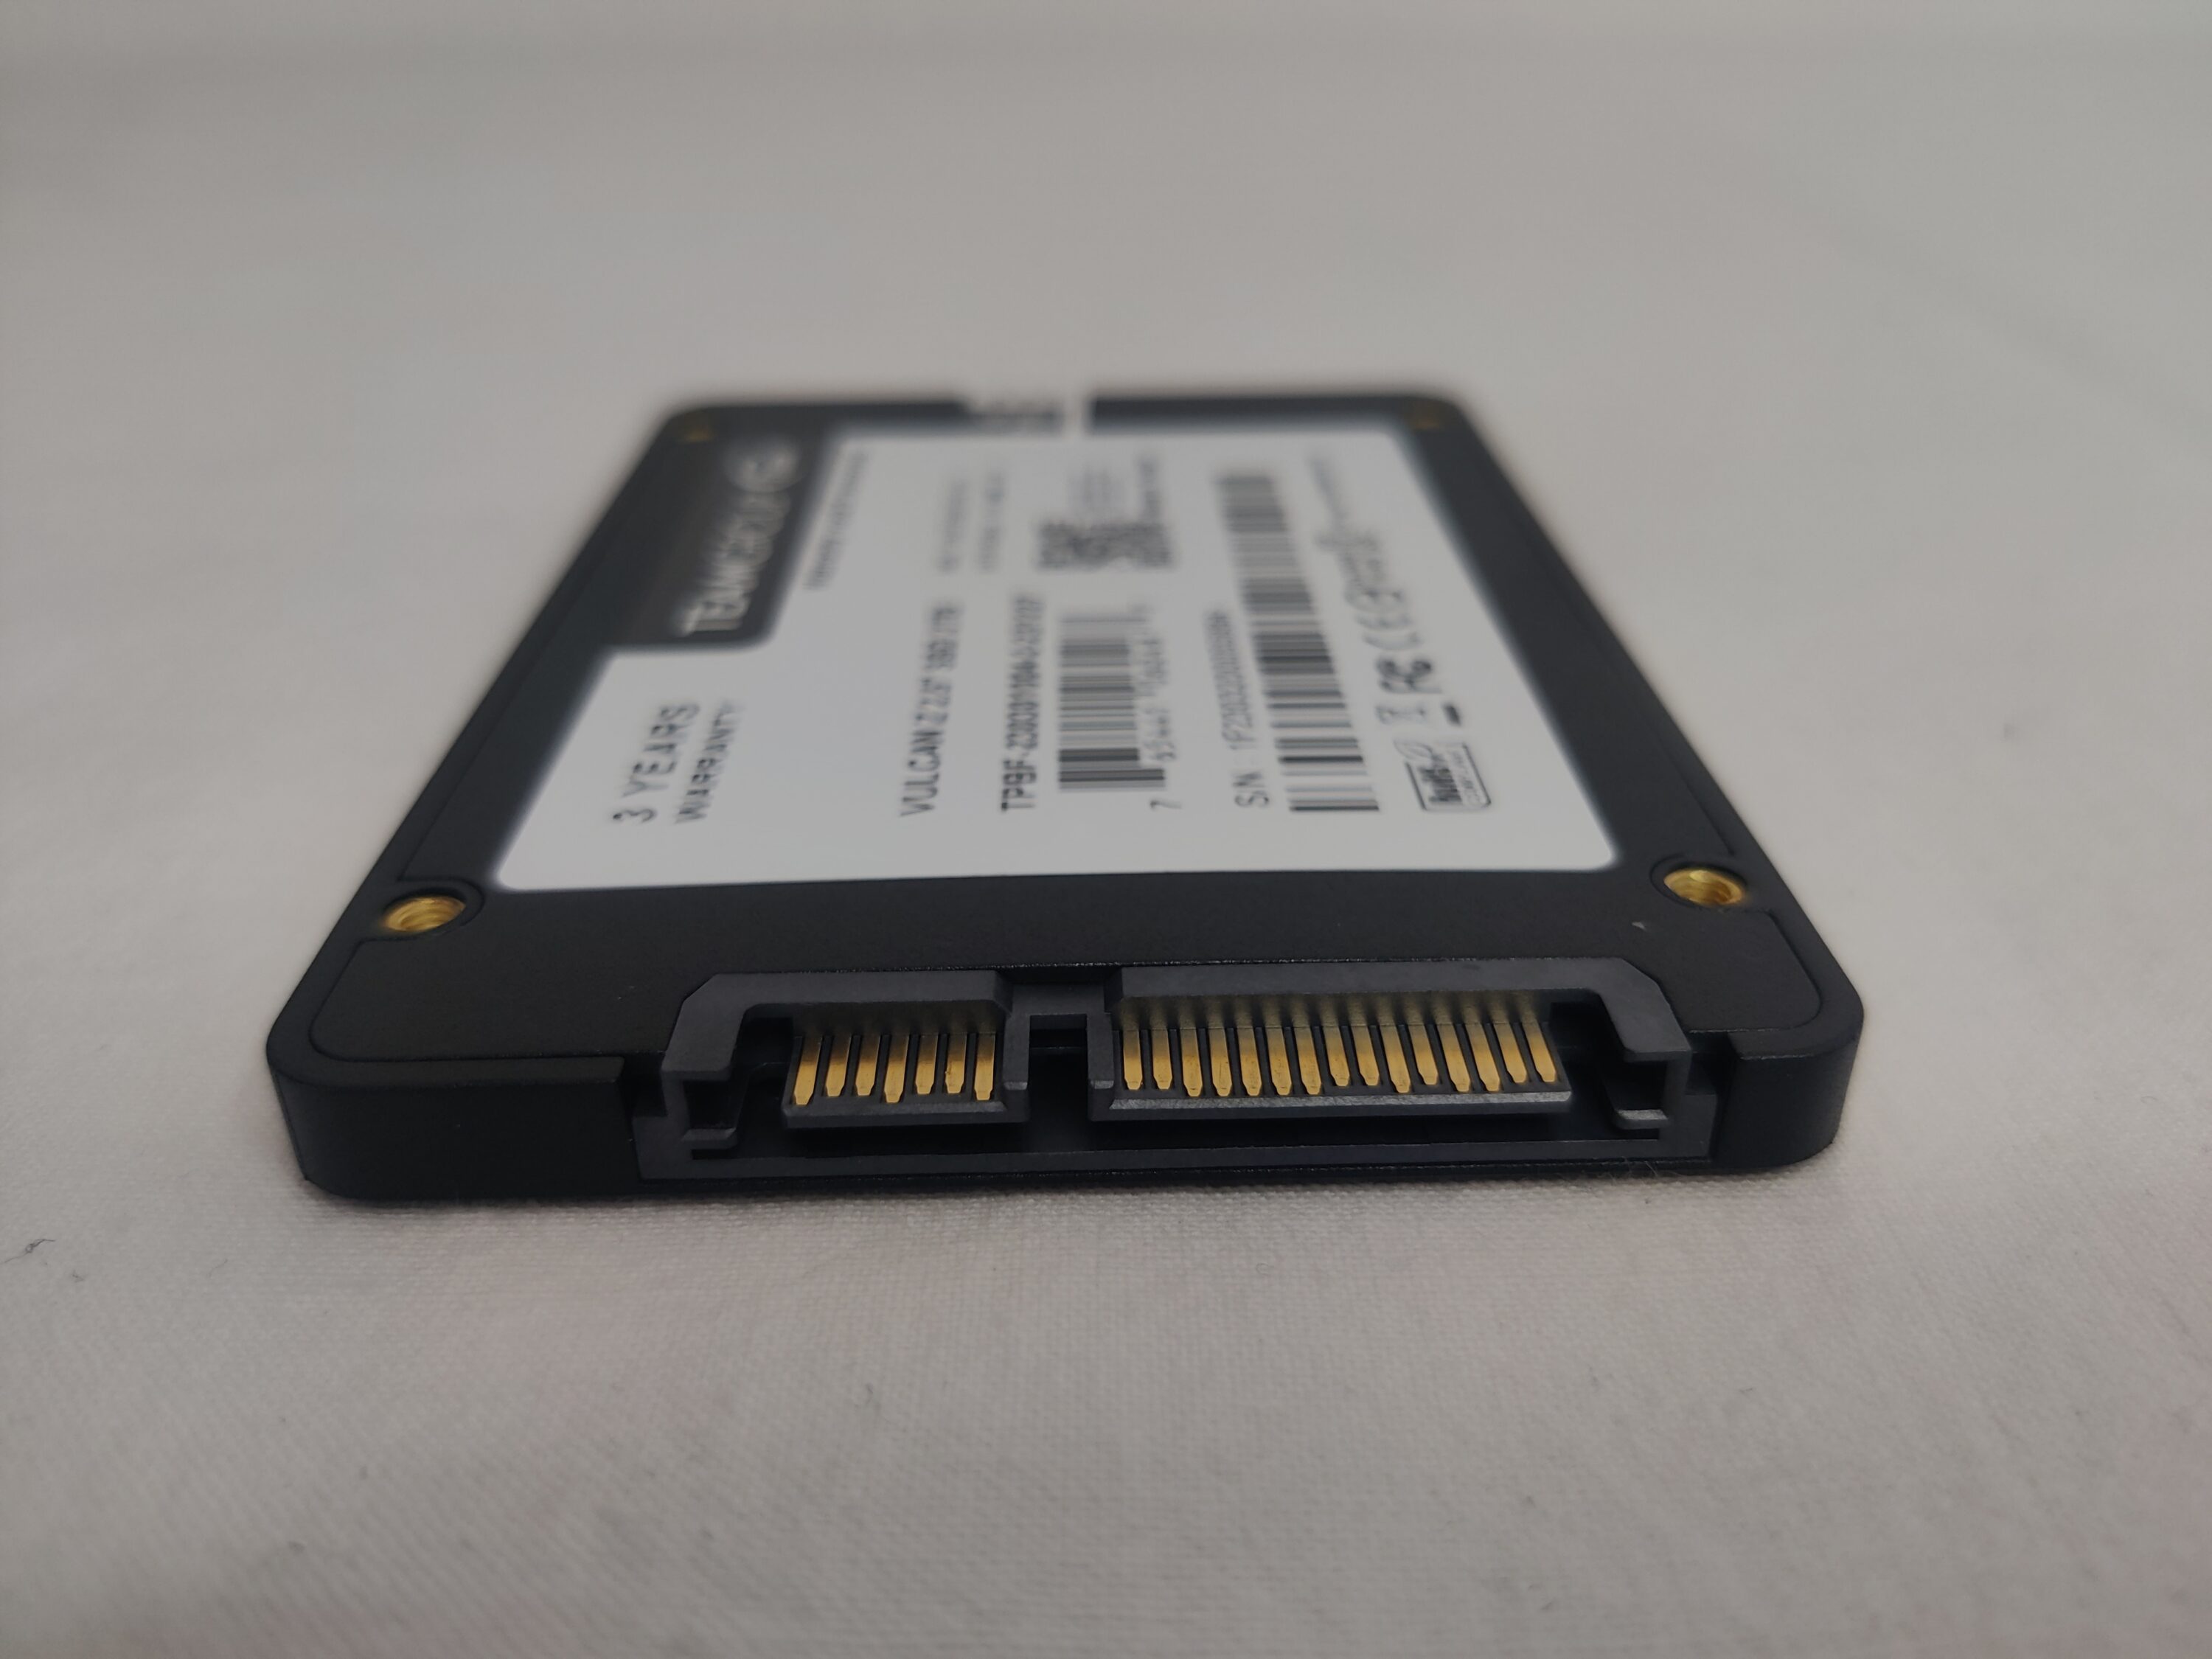
The TEAMGROUP VULCAN Z 2 TB from the T-FORCE series uses the SATA III interface, which is the common standard nowadays. This allows for high compatibility with older systems or motherboards and is equally ideal for upgraders who do not have an M.2 slot, for example. Up to 6 Gbit/s can be transferred via this interface, whereas the VULCAN Z reaches a sequential read speed of around 550 MB/s and 500 MB/s in writing. Compared to conventional NAND flash memories, the installed 3D NAND technology offers a higher memory density and at the same time demonstrates better performance. The VULCAN Z has TRIM support for automated cleaning of data blocks that are no longer needed, which results in better long-term stability. The SATA SSD’s resistance is up to 20 G, so the entry-level gaming SSD is also suitable as a solid companion for laptops. Furthermore, TeamGroup installs the Silicon Motion SM2258XT as controller. The VULCAN Z of the T-FORCE series is compatible with Windows 7, MAC OS 10.4 as well as Linux 2.6.33 or newer versions. Optionally, the hard drive’s S.M.A.R.T values can be read out via a third-party tool or via TeamGroups SSD S.M.A.R.T. TOOL.


A look into CrystalDiskInfo reveals a first impression of the SSD:

Test system
Our test system consists of the following components:
- AMD Ryzen 7 7800X3D
- ASUS ROG STRIX X670E-A GAMING WIFI
- Corsair VENGEANCE RGB DDR5 RAM 32GB 6000MHz CL30 AMD EXPO
- XFX Speedster MERC310 AMD Radeon RX 7900XTX
- NZXT Kraken 280 RGB
- ENERMAX Revolution D.F.X 1050W
- be quiet! Pure Base 500DX
Any benchmarks we handled in this constellation. Assembling the TeamGroup VULCAN Z 2 TB is a relatively simple process and completed within a few minutes. All that is required is to connect the VULCAN Z to the motherboard with a SATA data cable. Furthermore, SATA SSD’s require a regular power supply, which is why they still need to be connected via the power cable of the power supply.

Performancetest
For the SATA SSD test, we rely on proven tools to be able to test hard drives in detail for their performance. Several programs are used for this purpose in order to be able to cover the largest possible use case:
- CrystalDiskMark
- AS SSD Benchmark
- ATTO DISK Benchmark
- HD Tune Pro
Results of the performance test
To begin, let’s look at the AS SSD benchmark. At this point, the TeamGroup VULCAN Z 2 TB is more likely to make it to the midfield and lose out compared to the established Samsung SSDs. We were able to achieve the manufacturer’s stated values of around 550 MB/s in sequential read as well as 500 MB/s in write for the most part. If we now move on to the AS SSD Copy benchmark, we notice that the TeamGroup VULCAN Z 2 TB can make up a few places. In the ISO test, the VULCAN Z can hit the bull’s eye and dethrone the SanDisk Ultra 3D by 5 MB/s. However, the SSD can only place itself in the midfield in the HD Tune Pro benchmark with an average value of 360 MB/s and has to admit defeat to the Samsung SSDs. The TeamGroup VULCAN Z 2 TB achieves good rates in the access times, but cannot make up any more places here either. The temperatures were read with CrystalDiskMark at different points during the test. These settled in a range between 42° and 50° Celsius.
In summary, the TeamGroup VULCAN Z 2 TB achieves good, but not outstanding rates in our performance test. The charts therefore look as follows in detail:
| wdt_ID | SSD | Seq (lesen, MB/s) | Seq (schreiben, MB/s) | 4K (lesen, MB/s) | 4K (schreiben, MB/s) | 4K-64-Thrd (lesen, MB/s) | 4K-64-Thrd (schreiben, MB/s) |
|---|---|---|---|---|---|---|---|
| 1 | Toshiba Q300 Pro 1TB | 506,29 | 468,26 | 20,07 | 83,41 | 353,98 | 228,57 |
| 2 | Crucial BX300 480 GB | 516,37 | 472,97 | 32,40 | 113,85 | 376,93 | 349,97 |
| 3 | Samsung SSD 860 PRO 1 TB | 526,20 | 498,49 | 45,57 | 129,23 | 377,11 | 340,89 |
| 4 | Samsung SSD 860 EVO 1 TB | 528,46 | 498,50 | 43,69 | 130,20 | 378,80 | 342,79 |
| 5 | SanDisk Ultra 3D 500 GB | 489,92 | 496,99 | 36,36 | 88,72 | 373,74 | 334,34 |
| 7 | Toshiba TR200 960 GB | 463,37 | 371,80 | 27,40 | 70,12 | 268,58 | 168,03 |
| 8 | Verbatim Vi560 S3 512 GB | 522,71 | 460,83 | 15,56 | 92,66 | 205,45 | 220,96 |
| 9 | Samsung SSD 870 QVO 1 TB | 523,80 | 494,89 | 35,53 | 96,22 | 368,67 | 331,16 |
| 10 | LC-Power Phoenix 480 GB | 517,78 | 401,51 | 24,52 | 70,22 | 238,72 | 226,73 |
| 11 | Samsung SSD 870 EVO 2 TB | 526,54 | 493,04 | 37,07 | 90,57 | 372,59 | 337,20 |
| SSD | Seq (lesen, MB/s) | Seq (schreiben, MB/s) | 4K (lesen, MB/s) | 4K (schreiben, MB/s) | 4K-64-Thrd (lesen, MB/s) | 4K-64-Thrd (schreiben, MB/s) |

| wdt_ID | SSD | AS SSD (schreiben) | HD Tune Pro |
|---|---|---|---|
| 1 | Toshiba Q300 Pro 1TB | 0,040 | 0,070 |
| 2 | Crucial BX300 480 GB | 0,050 | 0,028 |
| 3 | Samsung SSD 860 PRO 1 TB | 0,025 | 0,028 |
| 4 | Samsung SSD 860 EVO 1 TB | 0,024 | 0,027 |
| 5 | SanDisk Ultra 3D 500 GB | 0,089 | 0,035 |
| 7 | Toshiba TR200 960 GB | 2,057 | 0,024 |
| 8 | Verbatim Vi560 S3 512 GB | 2,501 | 0,039 |
| 9 | Samsung SSD 870 QVO 1 TB | 0,345 | 0,030 |
| 10 | LC-Power Phoenix 480 GB | 2,725 | 0,031 |
| 11 | Samsung SSD 870 EVO 2 TB | 0,037 | 0,031 |
| SSD | AS SSD (schreiben) | HD Tune Pro |
| wdt_ID | SSD | ISO (in MB/s) | Programm (in MB/s) | Spiel (in MB/s) |
|---|---|---|---|---|
| 1 | Toshiba Q300 Pro 1TB | 380,64 | 193,10 | 244,38 |
| 2 | Crucial BX300 480 GB | 257,05 | 105,71 | 183,26 |
| 3 | Samsung SSD 860 PRO 1 TB | 475,42 | 328,58 | 456,63 |
| 4 | Samsung SSD 860 EVO 1 TB | 460,70 | 327,49 | 440,99 |
| 5 | SanDisk Ultra 3D 500 GB | 561,93 | 416,23 | 505,09 |
| 7 | Toshiba TR200 960 GB | 252,77 | 131,44 | 146,53 |
| 8 | Verbatim Vi560 S3 512 GB | 267,41 | 109,81 | 196,38 |
| 9 | Samsung SSD 870 QVO 1 TB | 269,89 | 118,24 | 243,96 |
| 10 | LC-Power Phoenix 480 GB | 215,69 | 103,90 | 186,73 |
| 11 | Samsung SSD 870 EVO 2 TB | 472,84 | 309,70 | 438,83 |
| SSD | ISO (in MB/s) | Programm (in MB/s) | Spiel (in MB/s) |
| wdt_ID | SSD | Minimum (in MB/s) | Maximum (in MB/s) | Average (in MB/s) |
|---|---|---|---|---|
| 1 | Toshiba Q300 Pro 1TB | 298,10 | 408,00 | 351,10 |
| 2 | Crucial BX300 480 GB | 323,60 | 443,30 | 428,40 |
| 3 | Samsung SSD 860 PRO 1 TB | 438,00 | 460,30 | 456,40 |
| 4 | Samsung SSD 860 EVO 1 TB | 451,30 | 459,30 | 456,90 |
| 5 | SanDisk Ultra 3D 500 GB | 415,70 | 438,20 | 434,60 |
| 7 | Toshiba TR200 960 GB | 447,30 | 455,90 | 454,70 |
| 8 | Verbatim Vi560 S3 512 GB | 306,20 | 349,40 | 324,30 |
| 9 | Samsung SSD 870 QVO 1 TB | 353,60 | 413,90 | 373,50 |
| 10 | LC-Power Phoenix 480 GB | 337,30 | 398,10 | 365,10 |
| 11 | Samsung SSD 870 EVO 2 TB | 313,80 | 370,10 | 337,10 |
| SSD | Minimum (in MB/s) | Maximum (in MB/s) | Average (in MB/s) |
| wdt_ID | SSD | 512 B | 1 KB | 2 KB | 4 KB | 8 KB | 16 KB | 32 KB | 64 KB | 128 KB | 256 KB | 512 KB | 1 MB | 2 MB | 4 MB | 8 MB | 12 MB | 16 MB | 24 MB | 32 MB | 48 MB | 64 MB |
|---|---|---|---|---|---|---|---|---|---|---|---|---|---|---|---|---|---|---|---|---|---|---|
| 5 | Toshiba Q300 Pro 1 TB | 12.288 | 26.425 | 50.688 | 88.969 | 131.657 | 216.627 | 293.011 | 354.146 | 406.935 | 444.835 | 468.590 | 480.421 | 484.759 | 486.957 | 492.542 | 488.872 | 492.542 | 489.954 | 490.293 | 490.470 | 492.542 |
| 6 | Crucial BX300 480 GB | 16.302 | 29.802 | 55.158 | 91.701 | 124.616 | 155.847 | 176.690 | 370.350 | 207.580 | 218.453 | 243.289 | 246.144 | 302.183 | 381.647 | 420.481 | 446.677 | 458.018 | 472.242 | 476.354 | 477.849 | 480.488 |
| 7 | Samsung SSD 860 PRO 1 TB | 21.067 | 40.091 | 74.240 | 131.766 | 212.460 | 304.158 | 387.404 | 444.311 | 483.066 | 504.123 | 515.270 | 520.385 | 524.288 | 526.922 | 524.615 | 524.506 | 524.124 | 523.960 | 524.369 | 524.192 | 524.016 |
| 8 | Samsung SSD 860 EVO 1 TB | 20.428 | 39.737 | 74.240 | 116.155 | 213.970 | 300.847 | 377.474 | 443.238 | 480.704 | 504.123 | 515.270 | 521.679 | 525.602 | 526.261 | 525.272 | 525.602 | 525.766 | 525.821 | 525.684 | 526.359 | 526.989 |
| 9 | SanDisk Ultra 3D 500 GB | 18.460 | 36.440 | 120.610 | 216.800 | 355.470 | 450.870 | 458.640 | 489.000 | 509.590 | 496.280 | 503.020 | 503.360 | 489.000 | 510.200 | 466.200 | 423.580 | 425.420 | 424.400 | 424.570 | 424.830 | 425.890 |
| 10 | Toshiba TR200 960 GB | 13.952 | 21.291 | 33.224 | 74.380 | 105.966 | 126.030 | 171.176 | 188.141 | 193.702 | 197.471 | 257.003 | 501.711 | 321.156 | 341.277 | 263.958 | 244.518 | 263.254 | 251.935 | 249.123 | 248.852 | 247.121 |
| 11 | Verbatim Vi560 S3 512 GB | 15.577 | 29.952 | 56.039 | 101.890 | 163.840 | 255.493 | 317.109 | 321.254 | 360.800 | 361.577 | 364.088 | 384.798 | 371.835 | 388.721 | 394.572 | 412.960 | 433.631 | 432.997 | 422.972 | 407.304 | 404.422 |
| 12 | Samsung SSD 870 QVO 1 TB | 14.720 | 28.855 | 54.511 | 100.101 | 169.560 | 254.862 | 333.371 | 354.248 | 412.575 | 459.901 | 489.988 | 505.337 | 516.539 | 518.455 | 518.455 | 518.882 | 518.579 | 520.385 | 520.950 | 519.439 | 518.637 |
| 13 | LC-Power Phoenix 480 GB | 12.323 | 21.852 | 1.777 | 18.662 | 17.266 | 19.980 | 242.128 | 338.979 | 370.958 | 418.951 | 436.906 | 442.437 | 445.255 | 443.841 | 445.018 | 443.060 | 440.346 | 439.347 | 439.366 | 439.653 | 439.102 |
| 14 | Samsung SSD 870 EVO 2 TB | 13.952 | 27.188 | 50.693 | 93.499 | 161.276 | 243.943 | 286.563 | 309.841 | 372.232 | 439.614 | 474.058 | 499.414 | 516.222 | 519.971 | 521.233 | 523.544 | 522.502 | 522.309 | 522.502 | 523.249 | 525.057 |
| SSD | 512 B | 1 KB | 2 KB | 4 KB | 8 KB | 16 KB | 32 KB | 64 KB | 128 KB | 256 KB | 512 KB | 1 MB | 2 MB | 4 MB | 8 MB | 12 MB | 16 MB | 24 MB | 32 MB | 48 MB | 64 MB |
| wdt_ID | SSD | 512 B | 1 KB | 2 KB | 4 KB | 8 KB | 16 KB | 32 KB | 64 KB | 128 KB | 256 KB | 512 KB | 1 MB | 2 MB | 4 MB | 8 MB | 12 MB | 16 MB | 24 MB | 32 MB | 48 MB | 64 MB |
|---|---|---|---|---|---|---|---|---|---|---|---|---|---|---|---|---|---|---|---|---|---|---|
| 5 | Toshiba Q300 Pro 1 TB | 6.194 | 13.212 | 24.778 | 93.499 | 143.382 | 223.665 | 283.402 | 343.344 | 404.103 | 438.584 | 467.424 | 479.349 | 482.580 | 478.281 | 481.498 | 482.031 | 479.349 | 480.835 | 481.498 | 481.532 | 481.498 |
| 6 | Crucial BX300 480 GB | 17.920 | 32.859 | 65.024 | 115.423 | 183.402 | 277.142 | 330.095 | 391.259 | 445.390 | 478.801 | 476.625 | 488.846 | 491.136 | 488.846 | 486.578 | 487.709 | 486.437 | 486.672 | 488.704 | 490.252 | 489.385 |
| 7 | Samsung SSD 860 PRO 1 TB | 21.833 | 41.984 | 78.140 | 136.192 | 210.417 | 303.104 | 385.505 | 442.368 | 477.203 | 499.321 | 514.007 | 517.815 | 521.679 | 516.539 | 517.495 | 516.752 | 514.165 | 516.327 | 515.112 | 516.940 | 516.687 |
| 8 | Samsung SSD 860 EVO 1 TB | 21.248 | 40.960 | 75.399 | 122.880 | 213.439 | 291.992 | 377.474 | 437.988 | 468.114 | 493.447 | 507.784 | 512.751 | 515.270 | 513.378 | 511.188 | 511.292 | 512.281 | 511.292 | 511.812 | 511.783 | 511.991 |
| 9 | SanDisk Ultra 3D 500 GB | 31.490 | 61.280 | 124.510 | 250.980 | 392.580 | 489.740 | 515.630 | 528.610 | 535.710 | 536.990 | 479.620 | 497.510 | 537.630 | 536.910 | 537.270 | 535.480 | 534.580 | 533.690 | 527.360 | 534.730 | 534.810 |
| 10 | Toshiba TR200 960 GB | 10.518 | 20.327 | 40.448 | 99.852 | 172.356 | 234.635 | 352.256 | 409.600 | 473.754 | 480.998 | 504.123 | 472.331 | 460.912 | 464.485 | 480.172 | 486.578 | 485.873 | 487.143 | 488.206 | 489.763 | 492.542 |
| 11 | Verbatim Vi560 S3 512 GB | 10.086 | 17.698 | 38.114 | 70.970 | 117.899 | 187.478 | 220.632 | 291.992 | 326.862 | 359.101 | 434.192 | 469.161 | 486.578 | 498.135 | 505.033 | 506.966 | 508.863 | 509.842 | 509.326 | 510.415 | 386.846 |
| 12 | Samsung SSD 870 QVO 1 TB | 15.360 | 29.952 | 56.690 | 102.654 | 171.602 | 253.318 | 330.908 | 349.102 | 401.871 | 455.336 | 493.447 | 502.914 | 505.337 | 501.711 | 502.612 | 500.712 | 506.100 | 508.708 | 506.941 | 509.734 | 510.697 |
| 13 | LC-Power Phoenix 480 GB | 11.080 | 20.378 | 41.671 | 66.064 | 114.401 | 200.704 | 281.788 | 312.076 | 373.601 | 443.238 | 484.330 | 483.214 | 471.270 | 502.311 | 493.447 | 508.195 | 502.311 | 508.297 | 509.403 | 509.432 | 510.166 |
| 14 | Samsung SSD 870 EVO 2 TB | 14.208 | 27.068 | 51.200 | 96.804 | 166.154 | 228.286 | 276.627 | 321.126 | 367.393 | 432.507 | 481.498 | 494.811 | 498.256 | 501.748 | 504.104 | 504.462 | 505.290 | 504.462 | 506.481 | 506.937 | 506.481 |
| SSD | 512 B | 1 KB | 2 KB | 4 KB | 8 KB | 16 KB | 32 KB | 64 KB | 128 KB | 256 KB | 512 KB | 1 MB | 2 MB | 4 MB | 8 MB | 12 MB | 16 MB | 24 MB | 32 MB | 48 MB | 64 MB |
TeamGroup VULCAN Z review: conclusion
In summary, the TeamGroup VULCAN Z in the 2 TB variant is a solid choice for entry-level gamers and those who do not yet have a fast M.2 slot. The capacity of 2 terabytes is sufficiently large to accommodate files of all kinds as well as the operating system. In terms of looks, the SSD cuts a good figure and integrates neatly into existing PC builds.
However, it was noticed in our benchmarks that the SATA SSD cannot predominantly hold its own in any discipline and is therefore somewhat lost in the masses. Especially in the highly competitive and meanwhile price-reduced SSD market, you can also get better SSD options from renowned providers on the market for a small surcharge.
Nevertheless, the stated 1 million hours of MTBF are decent and the VULCAN Z can also be used for a long time and stably in a system with around 1,600 TB of total bytes written. If you are looking for a solid budget SSD with a lot of memory, the TeamGroup VULCAN Z from the T-FORCE series is the right choice. However, if you have an M.2 slot in your system and flirt with a higher data transfer, you should rather go for the TeamGroup MP44, which achieved very good values in our test.

TeamGroup VULCAN Z
Access times
Transfer rate (Read)
Transfer rate (Write)
Value for money
85/100
Solid SATA SSD for users with a small budget or upgraders of older systems.
No replies yet
Neue Antworten laden...
Gehört zum Inventar
Beteilige dich an der Diskussion in der Basic Tutorials Community →