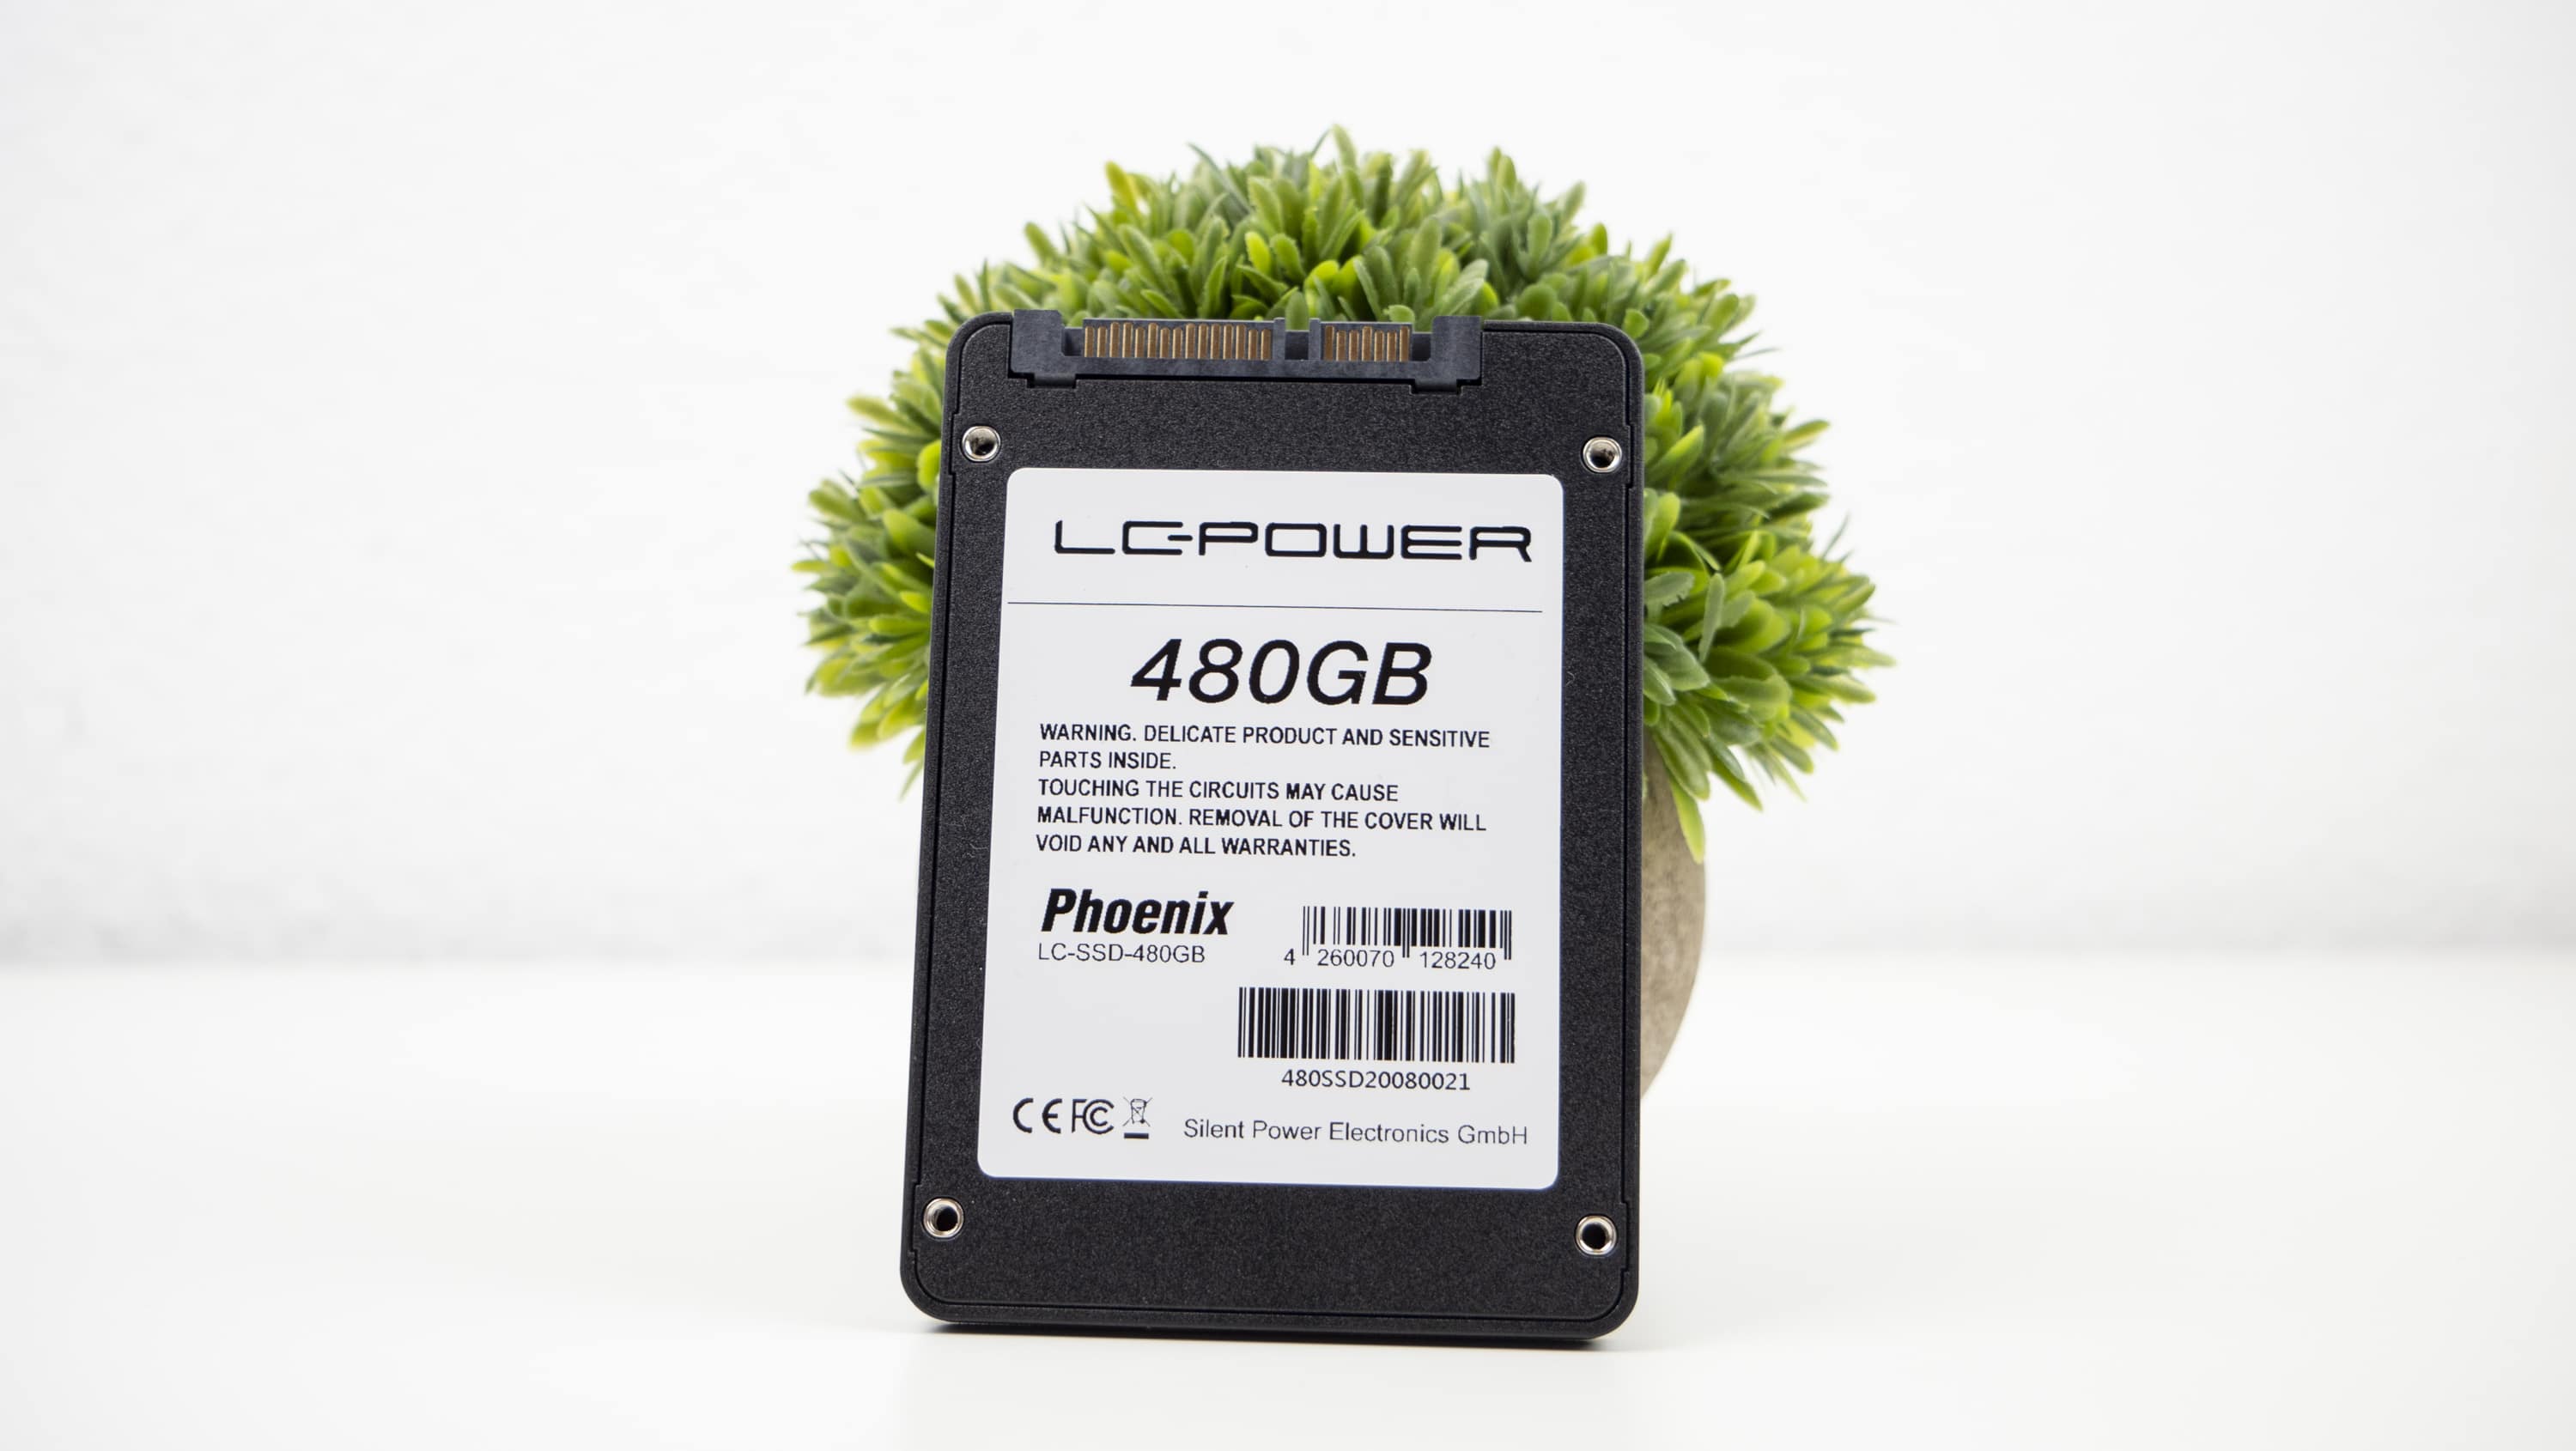
LC-Power is always good for a surprise. So you have to call the manufacturer slowly a real jack-of-all-trades. While the product range of the technology expert was very limited in the beginning, the company is now increasingly diversified. Not only the partly huge displays are popular. In addition, many PC hobbyists swear by the manufacturer’s cases. But this is not the end of the story. The company now produces almost everything that makes the PC hobbyist’s heart beat faster. Meanwhile LC-Power produces SSDs itself. As customers, we can only be happy about this. After all, growth on the supplier side usually stimulates competition. But can the SSDs from LC-Power also offer the performance that the manufacturer promises us? We will put the LC-Power Phoenix through its paces as part of our test. We have chosen the version with 480 GB storage space as a representative example.
Technical details
| form factor | SSD 2.5″ / 7 mm |
| interface | SATA III (6Gb/s) |
| capacity | 480 GB |
| read/write | 550/470 MB/s |
| Flash type | 3D NAND TLC |
| cache | SLC-Cache |
| dimension | 100 x 69,9 x 7 mm |
| weight | 31 g |
| price | from 54.12 Euro |
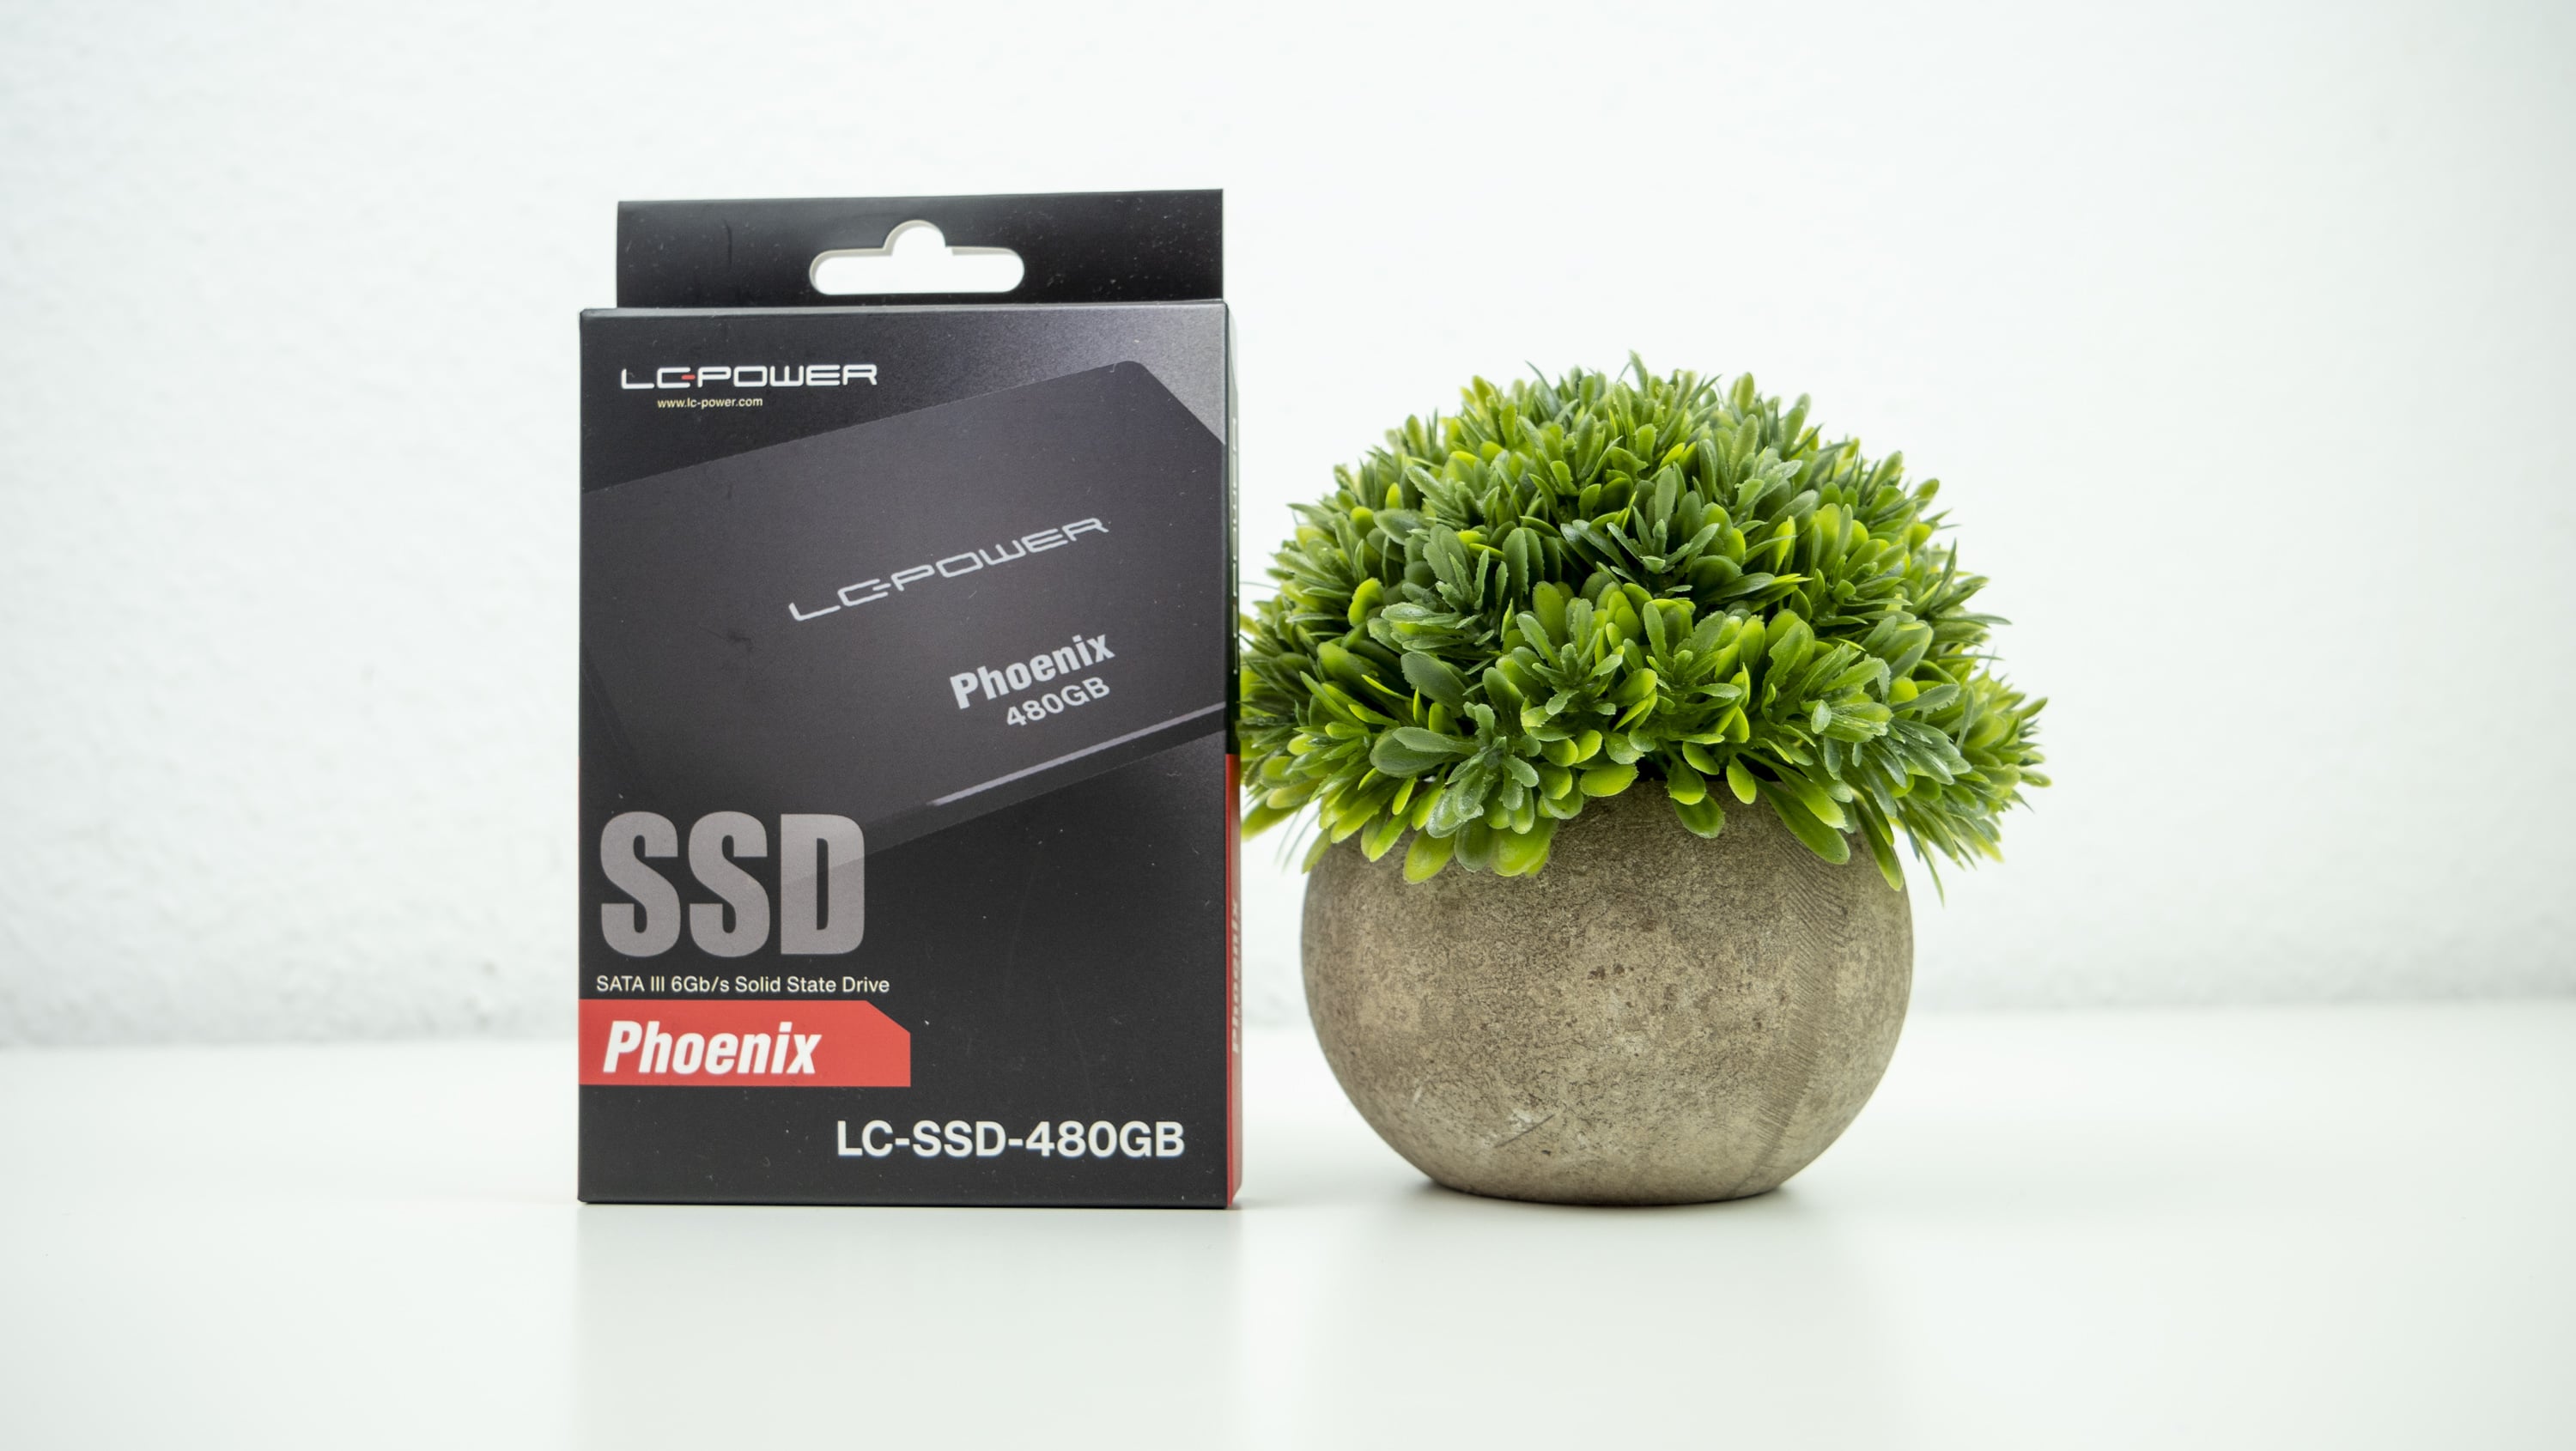
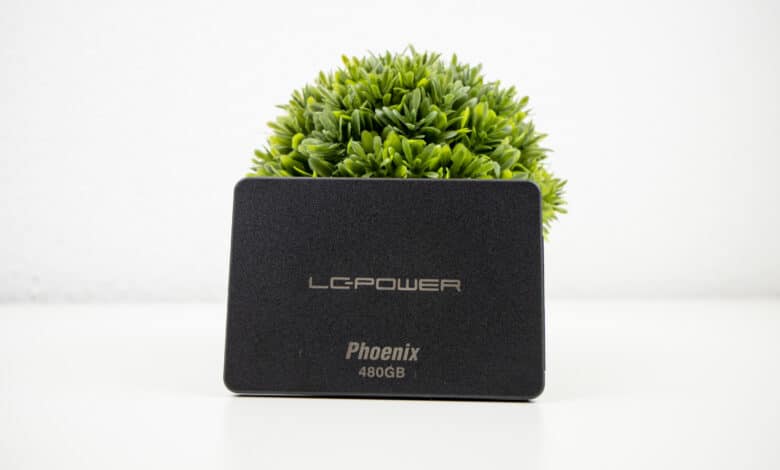
The first impression
If we take a look at the packaging of the Pheonix, the product is by no means ostentatious. We are merely holding a simple piece of cardboard in our hands. But that’s all you need. When you open the packaging, you can remove the SSD, which is in a separate plastic case. The Phoenix SSD uses a hard plastic case with no special features.
The test in our PC system
Optics and good workmanship are of course only secondary to an SSD for most people. Much more important is the performance in the in-house system. Accordingly, we fed the Phoenix SSD into our test system on behalf of the company. LC-Power itself promises a read speed of 550 MB/s and a write speed of 470 MB/s for its version with 480 GB storage capacity. We are curious to see how the SSD will perform.
Our test system
- MSI Z390I Gaming Edge AC Motherboard*
- Intel Core i5-9600K processor*
- 16 GB Corsair Vengeance RGB PRO 3200 RAM*
- MSI GeForce RTX 2070 Super Ventus GP OC graphics card*
- Corsair MP510 480GB SSD*
- Corsair SF450 power supply*
Benchmarks
- AS SSD Benchmark
- AS SSD Benchmark Score
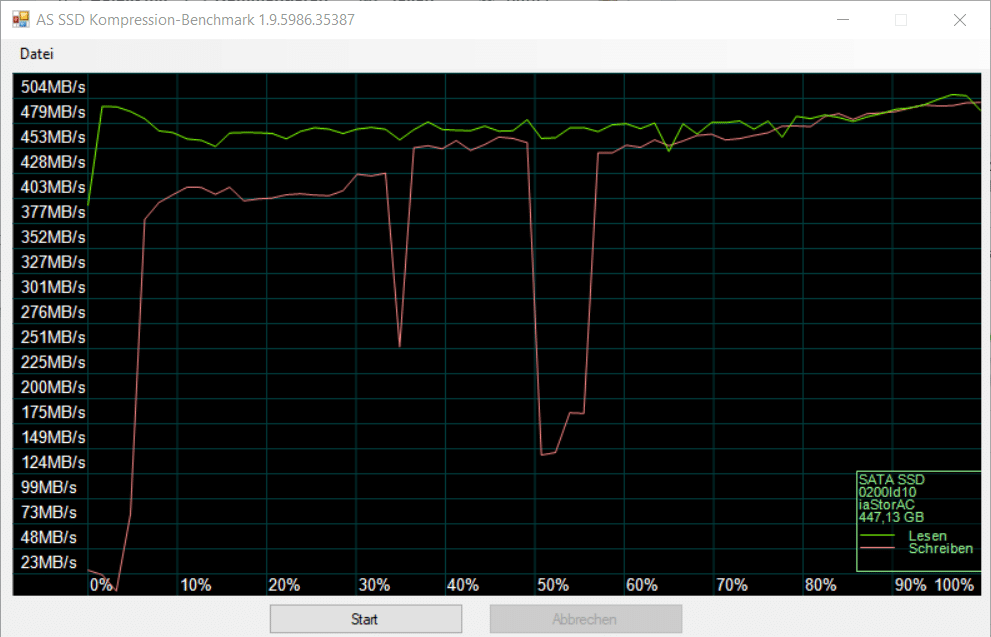
- AS SSD Compression Benchmark
- AS SSD Copy Benchmark
- Crystal DiskMark
- ATTO Disk Benchmark
- HD Tune
- Access times
| wdt_ID | SSD | Seq (lesen, MB/s) | Seq (schreiben, MB/s) | 4K (lesen, MB/s) | 4K (schreiben, MB/s) | 4K-64-Thrd (lesen, MB/s) | 4K-64-Thrd (schreiben, MB/s) |
|---|---|---|---|---|---|---|---|
| 1 | Toshiba Q300 Pro 1TB | 506,29 | 468,26 | 20,07 | 83,41 | 353,98 | 228,57 |
| 2 | Crucial BX300 480 GB | 516,37 | 472,97 | 32,40 | 113,85 | 376,93 | 349,97 |
| 3 | Samsung SSD 860 PRO 1 TB | 526,20 | 498,49 | 45,57 | 129,23 | 377,11 | 340,89 |
| 4 | Samsung SSD 860 EVO 1 TB | 528,46 | 498,50 | 43,69 | 130,20 | 378,80 | 342,79 |
| 5 | SanDisk Ultra 3D 500 GB | 489,92 | 496,99 | 36,36 | 88,72 | 373,74 | 334,34 |
| 7 | Toshiba TR200 960 GB | 463,37 | 371,80 | 27,40 | 70,12 | 268,58 | 168,03 |
| 8 | Verbatim Vi560 S3 512 GB | 522,71 | 460,83 | 15,56 | 92,66 | 205,45 | 220,96 |
| 9 | Samsung SSD 870 QVO 1 TB | 523,80 | 494,89 | 35,53 | 96,22 | 368,67 | 331,16 |
| 10 | LC-Power Phoenix 480 GB | 517,78 | 401,51 | 24,52 | 70,22 | 238,72 | 226,73 |
| 11 | Samsung SSD 870 EVO 2 TB | 526,54 | 493,04 | 37,07 | 90,57 | 372,59 | 337,20 |
| SSD | Seq (lesen, MB/s) | Seq (schreiben, MB/s) | 4K (lesen, MB/s) | 4K (schreiben, MB/s) | 4K-64-Thrd (lesen, MB/s) | 4K-64-Thrd (schreiben, MB/s) |
| wdt_ID | SSD | Lesen | Schreiben | Gesamt |
|---|---|---|---|---|
| 1 | Toshiba Q300 Pro 1TB | 425 | 359 | 1.004 |
| 2 | Crucial BX300 480 GB | 461 | 511 | 1.217 |
| 3 | Samsung SSD 860 PRO 1 TB | 474 | 520 | 1.252 |
| 4 | Samsung SSD 860 EVO 1 TB | 475 | 523 | 1.256 |
| 5 | SanDisk Ultra 3D 500 GB | 459 | 473 | 1.180 |
| 7 | Toshiba TR200 960 GB | 342 | 275 | 798 |
| 8 | Verbatim Vi560 S3 512 GB | 273 | 360 | 774 |
| 9 | Samsung SSD 870 QVO 1 TB | 457 | 477 | 1.178 |
| 10 | LC-Power Phoenix 480 GB | 315 | 337 | 816 |
| 11 | Samsung SSD 870 EVO 2 TB | 461 | 477 | 1.183 |
| SSD | Lesen | Schreiben | Gesamt |
| wdt_ID | SSD | ISO (in MB/s) | Programm (in MB/s) | Spiel (in MB/s) |
|---|---|---|---|---|
| 1 | Toshiba Q300 Pro 1TB | 380,64 | 193,10 | 244,38 |
| 2 | Crucial BX300 480 GB | 257,05 | 105,71 | 183,26 |
| 3 | Samsung SSD 860 PRO 1 TB | 475,42 | 328,58 | 456,63 |
| 4 | Samsung SSD 860 EVO 1 TB | 460,70 | 327,49 | 440,99 |
| 5 | SanDisk Ultra 3D 500 GB | 561,93 | 416,23 | 505,09 |
| 7 | Toshiba TR200 960 GB | 252,77 | 131,44 | 146,53 |
| 8 | Verbatim Vi560 S3 512 GB | 267,41 | 109,81 | 196,38 |
| 9 | Samsung SSD 870 QVO 1 TB | 269,89 | 118,24 | 243,96 |
| 10 | LC-Power Phoenix 480 GB | 215,69 | 103,90 | 186,73 |
| 11 | Samsung SSD 870 EVO 2 TB | 472,84 | 309,70 | 438,83 |
| SSD | ISO (in MB/s) | Programm (in MB/s) | Spiel (in MB/s) |
| wdt_ID | SSD | Seq Q32T1 (lesen, in MB/s) | Seq Q32T1 (schreiben, in MB/s) | 4K Q32T1 (lesen, in MB/s) | 4K Q32T1 (schreiben, in MB/s) | Seq (lesen, in MB/s) | Seq (schreiben, in MB/s) | 4K (lesen, in MB/s) | 4K (schreiben, in MB/s) |
|---|---|---|---|---|---|---|---|---|---|
| 1 | Toshiba Q300 Pro 1TB | 544,40 | 504,50 | 347,90 | 334,30 | 522,80 | 483,40 | 26,93 | 96,19 |
| 2 | Crucial BX300 480 GB | 552,90 | 514,20 | 377,20 | 356,30 | 535,30 | 499,10 | 32,73 | 143,10 |
| 3 | Samsung SSD 860 PRO 1 TB | 560,40 | 529,40 | 398,40 | 357,20 | 537,90 | 514,80 | 49,47 | 151,30 |
| 4 | Samsung SSD 860 EVO 1 TB | 562,20 | 533,10 | 403,10 | 359,00 | 551,30 | 522,80 | 48,49 | 155,00 |
| 5 | SanDisk Ultra 3D 500 GB | 563,00 | 534,10 | 394,70 | 361,10 | 294,10 | 276,90 | 40,71 | 110,60 |
| 6 | Toshiba TR200 960 GB | 549,60 | 519,80 | 307,90 | 256,00 | 483,40 | 398,60 | 29,31 | 79,30 |
| 7 | Verbatim Vi560 S3 512 GB | 560,50 | 373,10 | 252,80 | 189,30 | 507,50 | 372,70 | 24,52 | 91,99 |
| 8 | Samsung SSD 870 QVO 1 TB | 560,00 | 529,10 | 295,10 | 299,10 | 533,50 | 501,10 | 35,77 | 97,54 |
| 9 | LC-Power Phoenix 480 GB | 520,00 | 442,80 | 248,30 | 219,60 | 440,80 | 436,90 | 27,14 | 61,66 |
| 10 | Samsung SSD 870 EVO 2 TB | 561,40 | 528,90 | 312,80 | 284,50 | 542,20 | 503,00 | 42,89 | 93,74 |
| SSD | Seq Q32T1 (lesen, in MB/s) | Seq Q32T1 (schreiben, in MB/s) | 4K Q32T1 (lesen, in MB/s) | 4K Q32T1 (schreiben, in MB/s) | Seq (lesen, in MB/s) | Seq (schreiben, in MB/s) | 4K (lesen, in MB/s) | 4K (schreiben, in MB/s) |
| wdt_ID | SSD | 512 B | 1 KB | 2 KB | 4 KB | 8 KB | 16 KB | 32 KB | 64 KB | 128 KB | 256 KB | 512 KB | 1 MB | 2 MB | 4 MB | 8 MB | 12 MB | 16 MB | 24 MB | 32 MB | 48 MB | 64 MB |
|---|---|---|---|---|---|---|---|---|---|---|---|---|---|---|---|---|---|---|---|---|---|---|
| 5 | Toshiba Q300 Pro 1 TB | 12.288 | 26.425 | 50.688 | 88.969 | 131.657 | 216.627 | 293.011 | 354.146 | 406.935 | 444.835 | 468.590 | 480.421 | 484.759 | 486.957 | 492.542 | 488.872 | 492.542 | 489.954 | 490.293 | 490.470 | 492.542 |
| 6 | Crucial BX300 480 GB | 16.302 | 29.802 | 55.158 | 91.701 | 124.616 | 155.847 | 176.690 | 370.350 | 207.580 | 218.453 | 243.289 | 246.144 | 302.183 | 381.647 | 420.481 | 446.677 | 458.018 | 472.242 | 476.354 | 477.849 | 480.488 |
| 7 | Samsung SSD 860 PRO 1 TB | 21.067 | 40.091 | 74.240 | 131.766 | 212.460 | 304.158 | 387.404 | 444.311 | 483.066 | 504.123 | 515.270 | 520.385 | 524.288 | 526.922 | 524.615 | 524.506 | 524.124 | 523.960 | 524.369 | 524.192 | 524.016 |
| 8 | Samsung SSD 860 EVO 1 TB | 20.428 | 39.737 | 74.240 | 116.155 | 213.970 | 300.847 | 377.474 | 443.238 | 480.704 | 504.123 | 515.270 | 521.679 | 525.602 | 526.261 | 525.272 | 525.602 | 525.766 | 525.821 | 525.684 | 526.359 | 526.989 |
| 9 | SanDisk Ultra 3D 500 GB | 18.460 | 36.440 | 120.610 | 216.800 | 355.470 | 450.870 | 458.640 | 489.000 | 509.590 | 496.280 | 503.020 | 503.360 | 489.000 | 510.200 | 466.200 | 423.580 | 425.420 | 424.400 | 424.570 | 424.830 | 425.890 |
| 10 | Toshiba TR200 960 GB | 13.952 | 21.291 | 33.224 | 74.380 | 105.966 | 126.030 | 171.176 | 188.141 | 193.702 | 197.471 | 257.003 | 501.711 | 321.156 | 341.277 | 263.958 | 244.518 | 263.254 | 251.935 | 249.123 | 248.852 | 247.121 |
| 11 | Verbatim Vi560 S3 512 GB | 15.577 | 29.952 | 56.039 | 101.890 | 163.840 | 255.493 | 317.109 | 321.254 | 360.800 | 361.577 | 364.088 | 384.798 | 371.835 | 388.721 | 394.572 | 412.960 | 433.631 | 432.997 | 422.972 | 407.304 | 404.422 |
| 12 | Samsung SSD 870 QVO 1 TB | 14.720 | 28.855 | 54.511 | 100.101 | 169.560 | 254.862 | 333.371 | 354.248 | 412.575 | 459.901 | 489.988 | 505.337 | 516.539 | 518.455 | 518.455 | 518.882 | 518.579 | 520.385 | 520.950 | 519.439 | 518.637 |
| 13 | LC-Power Phoenix 480 GB | 12.323 | 21.852 | 1.777 | 18.662 | 17.266 | 19.980 | 242.128 | 338.979 | 370.958 | 418.951 | 436.906 | 442.437 | 445.255 | 443.841 | 445.018 | 443.060 | 440.346 | 439.347 | 439.366 | 439.653 | 439.102 |
| 14 | Samsung SSD 870 EVO 2 TB | 13.952 | 27.188 | 50.693 | 93.499 | 161.276 | 243.943 | 286.563 | 309.841 | 372.232 | 439.614 | 474.058 | 499.414 | 516.222 | 519.971 | 521.233 | 523.544 | 522.502 | 522.309 | 522.502 | 523.249 | 525.057 |
| SSD | 512 B | 1 KB | 2 KB | 4 KB | 8 KB | 16 KB | 32 KB | 64 KB | 128 KB | 256 KB | 512 KB | 1 MB | 2 MB | 4 MB | 8 MB | 12 MB | 16 MB | 24 MB | 32 MB | 48 MB | 64 MB |
| wdt_ID | SSD | 512 B | 1 KB | 2 KB | 4 KB | 8 KB | 16 KB | 32 KB | 64 KB | 128 KB | 256 KB | 512 KB | 1 MB | 2 MB | 4 MB | 8 MB | 12 MB | 16 MB | 24 MB | 32 MB | 48 MB | 64 MB |
|---|---|---|---|---|---|---|---|---|---|---|---|---|---|---|---|---|---|---|---|---|---|---|
| 5 | Toshiba Q300 Pro 1 TB | 6.194 | 13.212 | 24.778 | 93.499 | 143.382 | 223.665 | 283.402 | 343.344 | 404.103 | 438.584 | 467.424 | 479.349 | 482.580 | 478.281 | 481.498 | 482.031 | 479.349 | 480.835 | 481.498 | 481.532 | 481.498 |
| 6 | Crucial BX300 480 GB | 17.920 | 32.859 | 65.024 | 115.423 | 183.402 | 277.142 | 330.095 | 391.259 | 445.390 | 478.801 | 476.625 | 488.846 | 491.136 | 488.846 | 486.578 | 487.709 | 486.437 | 486.672 | 488.704 | 490.252 | 489.385 |
| 7 | Samsung SSD 860 PRO 1 TB | 21.833 | 41.984 | 78.140 | 136.192 | 210.417 | 303.104 | 385.505 | 442.368 | 477.203 | 499.321 | 514.007 | 517.815 | 521.679 | 516.539 | 517.495 | 516.752 | 514.165 | 516.327 | 515.112 | 516.940 | 516.687 |
| 8 | Samsung SSD 860 EVO 1 TB | 21.248 | 40.960 | 75.399 | 122.880 | 213.439 | 291.992 | 377.474 | 437.988 | 468.114 | 493.447 | 507.784 | 512.751 | 515.270 | 513.378 | 511.188 | 511.292 | 512.281 | 511.292 | 511.812 | 511.783 | 511.991 |
| 9 | SanDisk Ultra 3D 500 GB | 31.490 | 61.280 | 124.510 | 250.980 | 392.580 | 489.740 | 515.630 | 528.610 | 535.710 | 536.990 | 479.620 | 497.510 | 537.630 | 536.910 | 537.270 | 535.480 | 534.580 | 533.690 | 527.360 | 534.730 | 534.810 |
| 10 | Toshiba TR200 960 GB | 10.518 | 20.327 | 40.448 | 99.852 | 172.356 | 234.635 | 352.256 | 409.600 | 473.754 | 480.998 | 504.123 | 472.331 | 460.912 | 464.485 | 480.172 | 486.578 | 485.873 | 487.143 | 488.206 | 489.763 | 492.542 |
| 11 | Verbatim Vi560 S3 512 GB | 10.086 | 17.698 | 38.114 | 70.970 | 117.899 | 187.478 | 220.632 | 291.992 | 326.862 | 359.101 | 434.192 | 469.161 | 486.578 | 498.135 | 505.033 | 506.966 | 508.863 | 509.842 | 509.326 | 510.415 | 386.846 |
| 12 | Samsung SSD 870 QVO 1 TB | 15.360 | 29.952 | 56.690 | 102.654 | 171.602 | 253.318 | 330.908 | 349.102 | 401.871 | 455.336 | 493.447 | 502.914 | 505.337 | 501.711 | 502.612 | 500.712 | 506.100 | 508.708 | 506.941 | 509.734 | 510.697 |
| 13 | LC-Power Phoenix 480 GB | 11.080 | 20.378 | 41.671 | 66.064 | 114.401 | 200.704 | 281.788 | 312.076 | 373.601 | 443.238 | 484.330 | 483.214 | 471.270 | 502.311 | 493.447 | 508.195 | 502.311 | 508.297 | 509.403 | 509.432 | 510.166 |
| 14 | Samsung SSD 870 EVO 2 TB | 14.208 | 27.068 | 51.200 | 96.804 | 166.154 | 228.286 | 276.627 | 321.126 | 367.393 | 432.507 | 481.498 | 494.811 | 498.256 | 501.748 | 504.104 | 504.462 | 505.290 | 504.462 | 506.481 | 506.937 | 506.481 |
| SSD | 512 B | 1 KB | 2 KB | 4 KB | 8 KB | 16 KB | 32 KB | 64 KB | 128 KB | 256 KB | 512 KB | 1 MB | 2 MB | 4 MB | 8 MB | 12 MB | 16 MB | 24 MB | 32 MB | 48 MB | 64 MB |
| wdt_ID | SSD | Minimum (in MB/s) | Maximum (in MB/s) | Average (in MB/s) |
|---|---|---|---|---|
| 1 | Toshiba Q300 Pro 1TB | 298,10 | 408,00 | 351,10 |
| 2 | Crucial BX300 480 GB | 323,60 | 443,30 | 428,40 |
| 3 | Samsung SSD 860 PRO 1 TB | 438,00 | 460,30 | 456,40 |
| 4 | Samsung SSD 860 EVO 1 TB | 451,30 | 459,30 | 456,90 |
| 5 | SanDisk Ultra 3D 500 GB | 415,70 | 438,20 | 434,60 |
| 7 | Toshiba TR200 960 GB | 447,30 | 455,90 | 454,70 |
| 8 | Verbatim Vi560 S3 512 GB | 306,20 | 349,40 | 324,30 |
| 9 | Samsung SSD 870 QVO 1 TB | 353,60 | 413,90 | 373,50 |
| 10 | LC-Power Phoenix 480 GB | 337,30 | 398,10 | 365,10 |
| 11 | Samsung SSD 870 EVO 2 TB | 313,80 | 370,10 | 337,10 |
| SSD | Minimum (in MB/s) | Maximum (in MB/s) | Average (in MB/s) |
| wdt_ID | SSD | AS SSD (schreiben) | HD Tune Pro |
|---|---|---|---|
| 1 | Toshiba Q300 Pro 1TB | 0,040 | 0,070 |
| 2 | Crucial BX300 480 GB | 0,050 | 0,028 |
| 3 | Samsung SSD 860 PRO 1 TB | 0,025 | 0,028 |
| 4 | Samsung SSD 860 EVO 1 TB | 0,024 | 0,027 |
| 5 | SanDisk Ultra 3D 500 GB | 0,089 | 0,035 |
| 7 | Toshiba TR200 960 GB | 2,057 | 0,024 |
| 8 | Verbatim Vi560 S3 512 GB | 2,501 | 0,039 |
| 9 | Samsung SSD 870 QVO 1 TB | 0,345 | 0,030 |
| 10 | LC-Power Phoenix 480 GB | 2,725 | 0,031 |
| 11 | Samsung SSD 870 EVO 2 TB | 0,037 | 0,031 |
| SSD | AS SSD (schreiben) | HD Tune Pro |
Unfortunately we had to find out in the benchmark that the Phoenix remains below the factory specifications. This applies to both read and write speed. In addition, the benchmark shows one or two drops in writing performance. However, all this can probably be tolerated considering the comparatively low price. So the Phoenix series from LC-Power is more than suitable for average users.
Conclusion
The Phoenix is literally a solid(e) state drive. Although manufacturer LC-Power has not launched a high-performance SSD on the market, the company probably does not want to do so. LC-Power sees manufacturers like SanDisk as competitors and does not want to mess with the industry leader Samsung. The SSD performs well, but does not achieve outstanding performance. For this, LC-Power can, as always, score points with an attractive price.

LC-Power Phoenix SSD
Access times
Transfer rate (read)
Transfer rate (write)
Value for money
81/100
LC-Power has done a good job with the Phoenix series. The manufacturer has succeeded in entering a further product segment!